ES Plan Week #19
ES Plan Week #19
I update via X based on this plan as the market session unfolds in real time. Make sure to follow for the real time market updates! X (Twitter)- trader_izzy

Link below into last weekend’s newsletter if any review is needed. Video breakdown included as well.

Here’s today’s layout, and as always in weekend newsletters **Video Recap included** at the bottom
ES Plan Week#18 Plan Recap
Daily Timeframe View
4H Timeframe View
1H Timeframe View
Playing Field- Putting it all together. Short/Long entries
SPX LEVELS
ES Week #18 Plan Recap
Great opportunities this past week and closing out another good month in the process as well. There were great set ups both short and long in this week as the market just traded in a range all week. I spoke about why patience and observation were going to be important skills to flex to start off the week due to market moving catalysts news and taking consideration the tough areas of resistance right above us.
The main range of focus was at the time 5128.75-4963.5 which was the 4H range at the time of the newsletter. This made 5128.75 a key level for buyers to hold to attempt a breakout through 5150 targeting 5176.5 and 5191.5 breakdown retest.
Very quiet session on Monday as every test of 5128.75 was met with buys but unable to follow through above 5150 making the session range very very tight and slow price action taking over.
Carrying on into Tuesday heading into the cash open the intraday range was set at 5135.5-5144.25 and sellers had already initiated power into the downside below 5135.5 triggering the first short pivot to start any downside momentum.
Buyers attempted to put in a reclaim back over 5135.5 but after a few attempts, sells overwhelmed the tape putting a move into 5104.5 1H lower pivot.
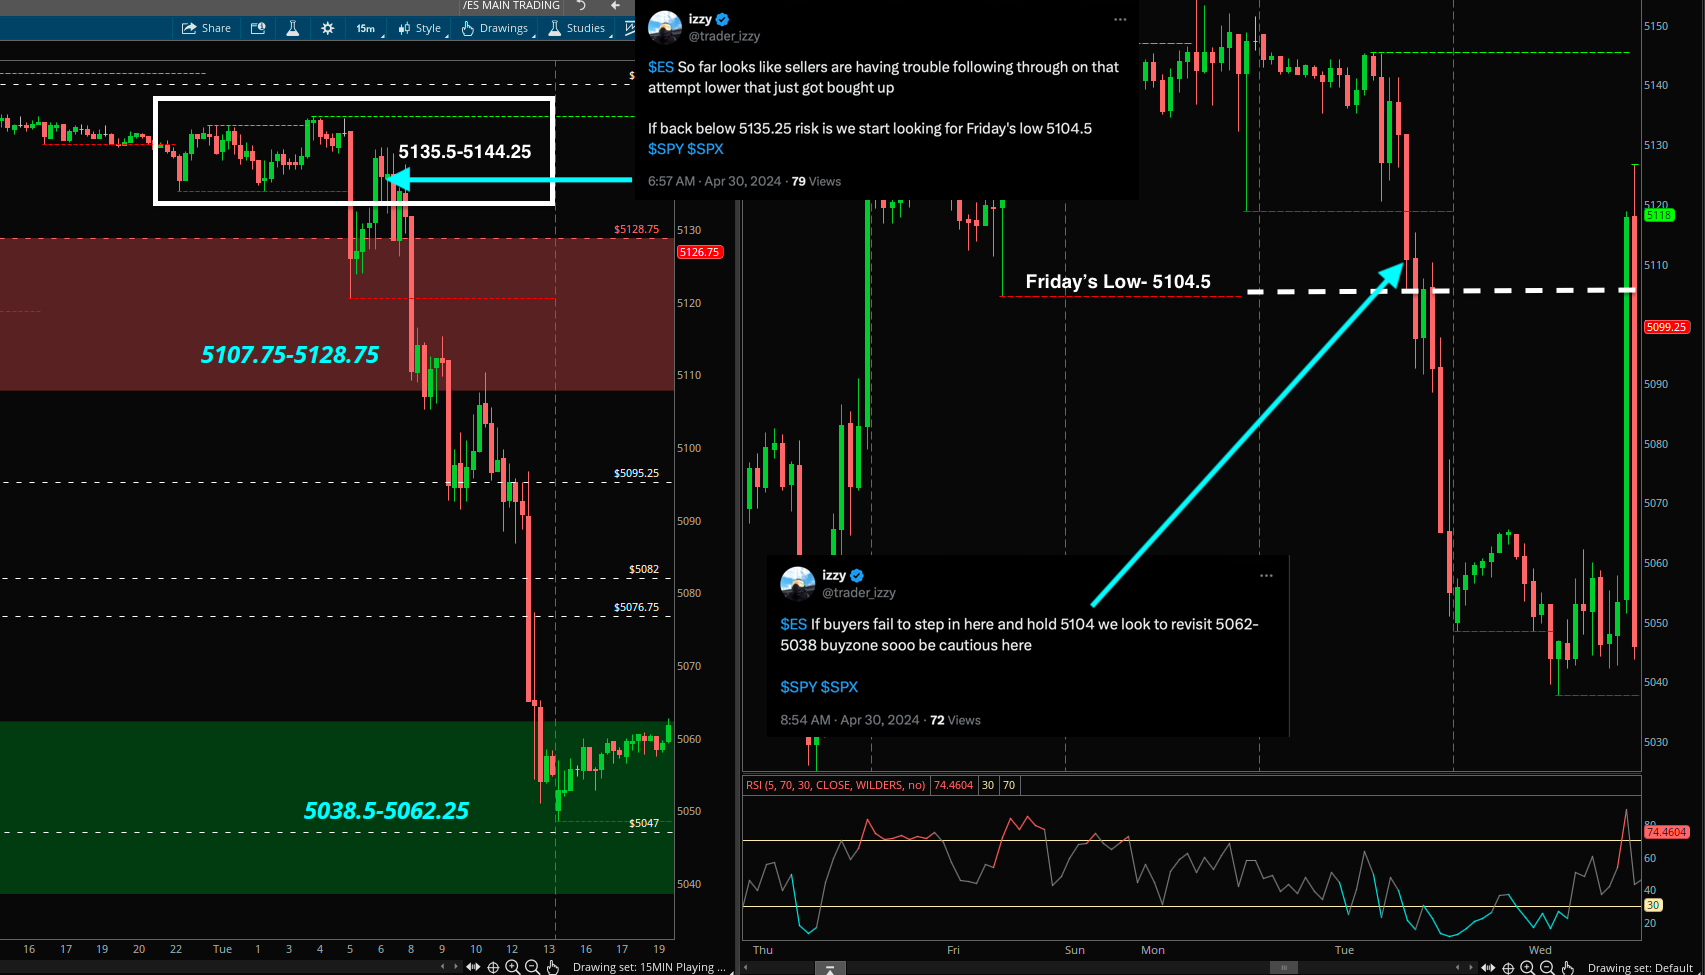
Unable to reclaim the short pivot of 5135.5 was the first red flag which was followed by failure to hold above the 4H pivot range 5128.75-4963.5.
Seeing these two bearish turning points is a sign to be patient on longs as there isn’t enough buying in this area of the market to keep it afloat and explore higher. This put 5104.5 on the scope and was the level to watch for a breakdown trade.

Below 5104.5 put the market right back into buy zone 5038.5-5062.25 to finish off Tuesday and setting up Wednesday FOMC day. We saw nothing but consolidation within this range Wednesday session up until 11:00AM PST that buyers triggered back through 5062.25 to set up a retest back into the zone of 5107.75-5128.75 which was still met with sellers reversing the move right back down in the same manner.
Into Thursday overnight traders attempted to move the market back up higher through 5062.25 and created a range of 5082.5-5066 heading into cash open to set up long and short intraday pivots.
Right into cash open on Thursday buyers attempted a break above 5082.5 which failed quickly and triggered 5066 short pivot into the targets of 5047/5037.75.
As mentioned in the tweet, “Focus into today is seeing if buyers can attempt to continue to defend 5037.75-5065.5” which proved right. Buyers stepped in right at the 5037.75 support and reclaimed back over 5066 intraday pivot that put shorts into play earlier into the session.
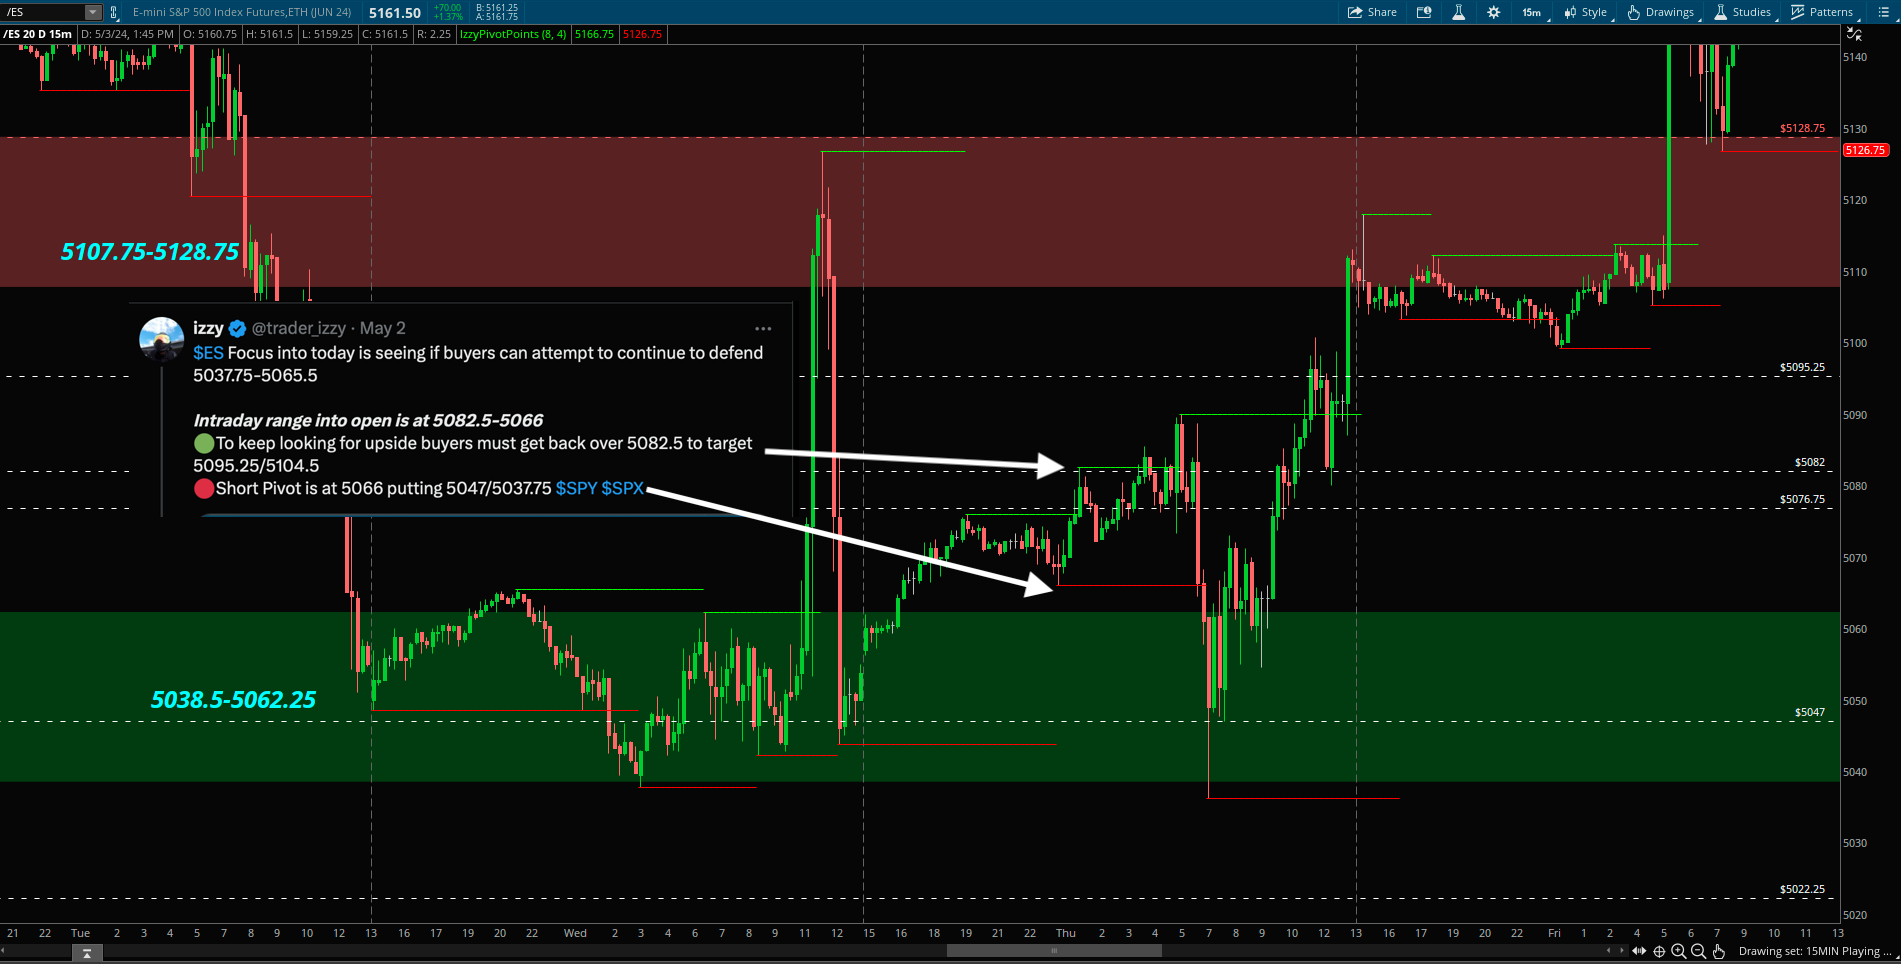
Seeing buyers step in here once more and reclaiming back over 5066 put the ball in their court for the rest of the Thursday session.
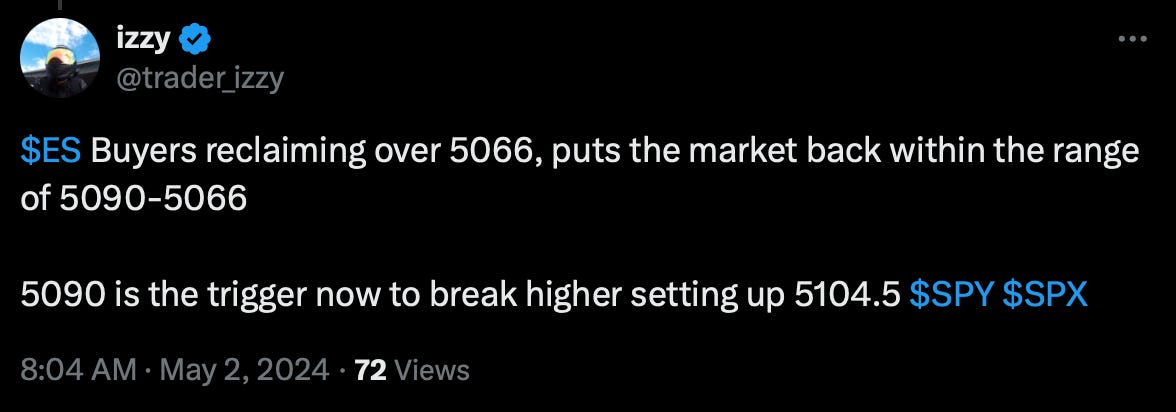
Buyers followed through above 5090 from the reclaim of 5066 and straight into 5104.5 upside target.
Friday session was very straight forward. Hold above 5104.5 and 5118 was the trigger as posted in the nightly newsletter to finish off the week to look for 5126.75/5145.5/5154.25.
As mentioned in the beginning of this newsletter, the market just traded within a wider range and closed the week out at the highs attempting to explore higher to start off May. When you focus on the wider range and take it session by session, one level at a time, you realize how simple trading can really be. It is all the outside noise of economical data and what it “could” mean, predictions of both biased bulls and bears that draw in your focus and make trading more difficult as all that noise clouds your perception with judgment. The markets have always been and always will be an uncertain environment. The faster you can accept that and stop looking for any “certainty” to back up your trades to try and eliminate the “fear” or anxiety of what may or may not happen… trading really becomes so much easier. Embrace being in that uncertainty, be curious about it. Uncertainty attracts fear for majority of participants because of what “negative” possibilities could happen that come with taking risk but when we look to avoid it and remain in our comfort zone there is no growth. Uncertainty, that is where the real growth is at and when approached with the right mindset and attitude… endless opportunities flow to us.
Let’s get into how this week is looking and how I plan to navigate.
Daily Timeframe Range 5333.5-4963.5
Zooming out into the widest timeframe allows us to see the bigger picture and the bigger range the market is in. We are reaching the middle ground of this wider range here along with a very important level both for sellers and buyers that I have been mentioning over and over and that is 5191.5.
I’ll breakdown the reasoning behind what makes this level interesting into this week and why it is the deciding factor for overall market direction. But here is the much bigger view and what this level does for buyers and sellers in terms of bigger upside and downside targets.
A reclaim of 5191.5 keeps 5333.5 Upper Pivot in play into the month of May
Unable to reclaim keeps April’s low 4963.5 into a possible retest in May.
As long as we remain within these two pivots, the market is just trading within this bigger timeframe range and it is all consolidation within this timeframe. No need to over complicate things here.

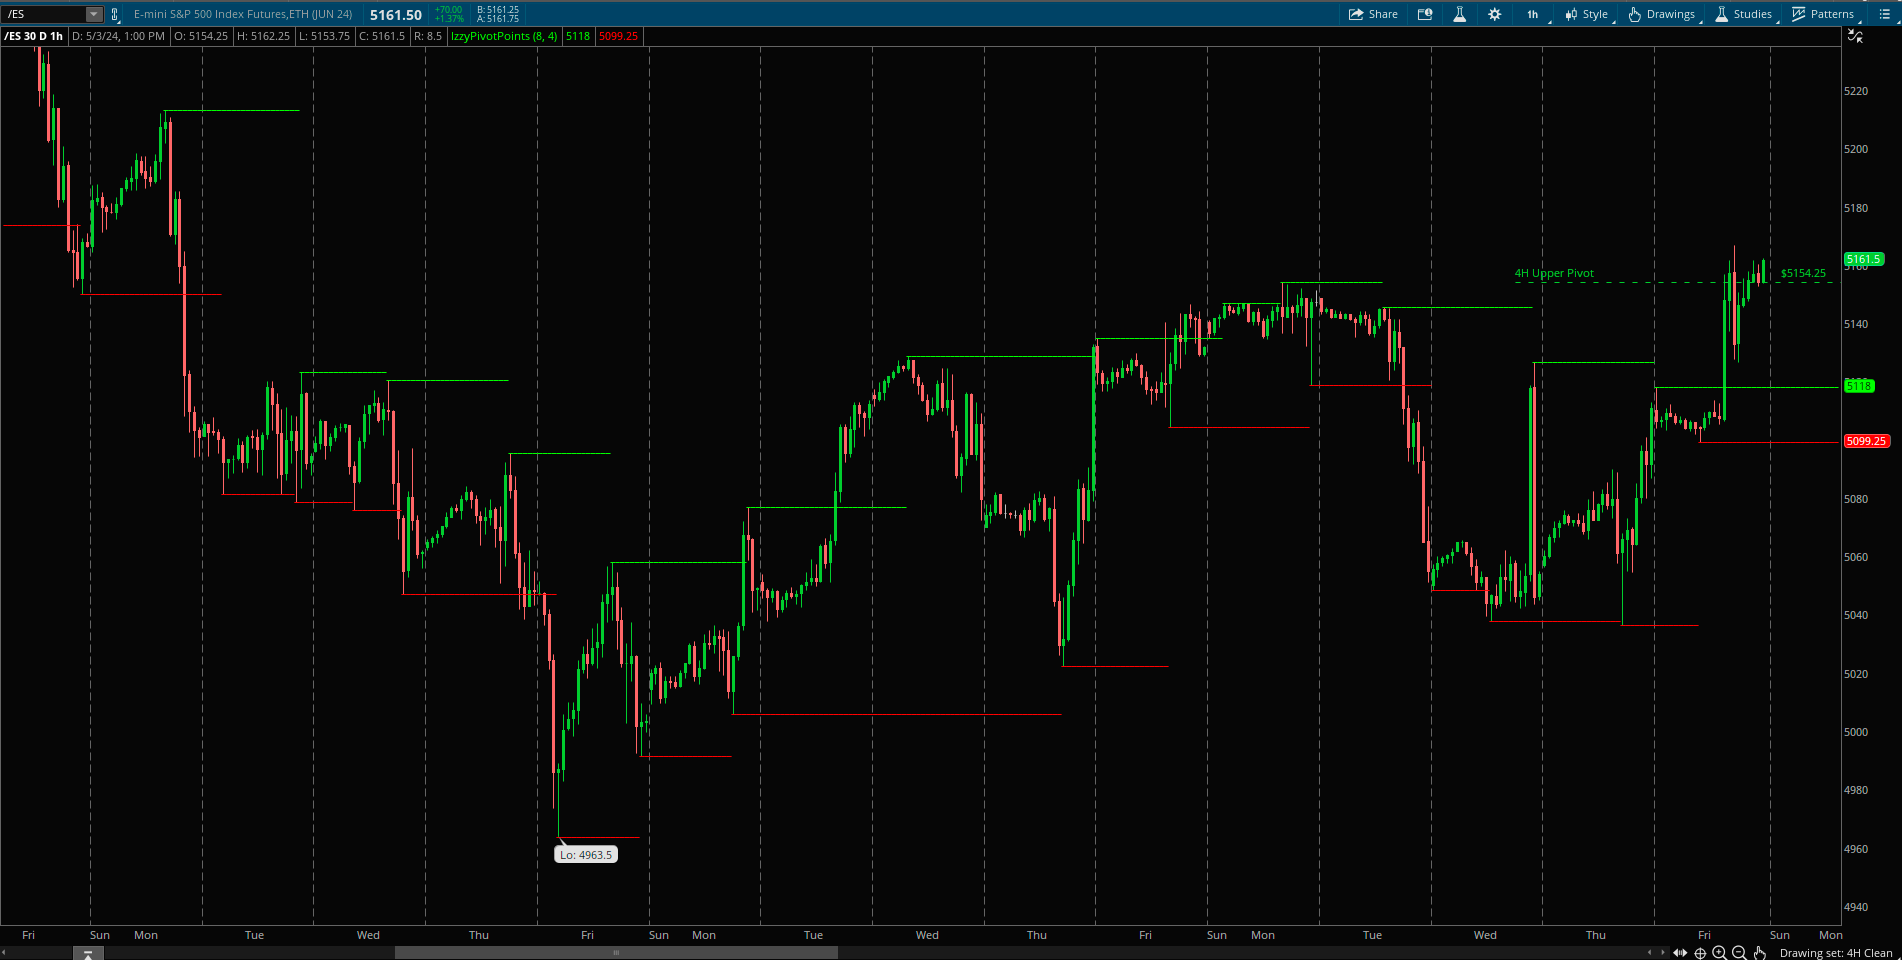
4H TimeFrame Range 5154.25-5022.25
ES Plan Week #16 explained how the break of 5191.5 put target scope into the daily timeframe lower pivot if you need review.
ES Plan Week #17 explains how we were coming near the bigger downside target based on the Daily TF range and how longs were setting up to look for a retracement back up targeting 5191.5 breakdown level
ES Plan Week #18 [Bulls Attempting a breakout here?] explains how it was best for buyers to hold 5104.5 level to trigger a breakout through 5118 setting up an attempt to breakout out above 5154.25 to start directly looking for 5191.5
There’s review above if needed to stay more attuned heading into this week. Moving forward now.
All about 5154.25 heading into this week based on this timeframe to set up 5191.5. Into Friday we saw buyers move the market outside of this range and setting up to explore higher. Exploring higher means 5176.5 and 5191.5 breakdown retest.
As mentioned above in the daily timeframe section, to keep 5333.5 longer term upside target in play it starts with a reclaim of 5191.5 which puts the market back into the range of 5191.5-5308.5 to set that up.
Unable to hold above 5154.25 is the first red flag as it just puts the market back into the range it has been in (5154.25-5022.25) with the lower downside target of 5022.25 for now.

1H Timeframe Range 5118-5099.25
So far we know…
The wider range the market is in based on the Daily Timeframe… check
We are approaching the previous range 5308.5-5191.5 based on the 4H Timeframe that the market failed to hold and saw aggressive selling…. check
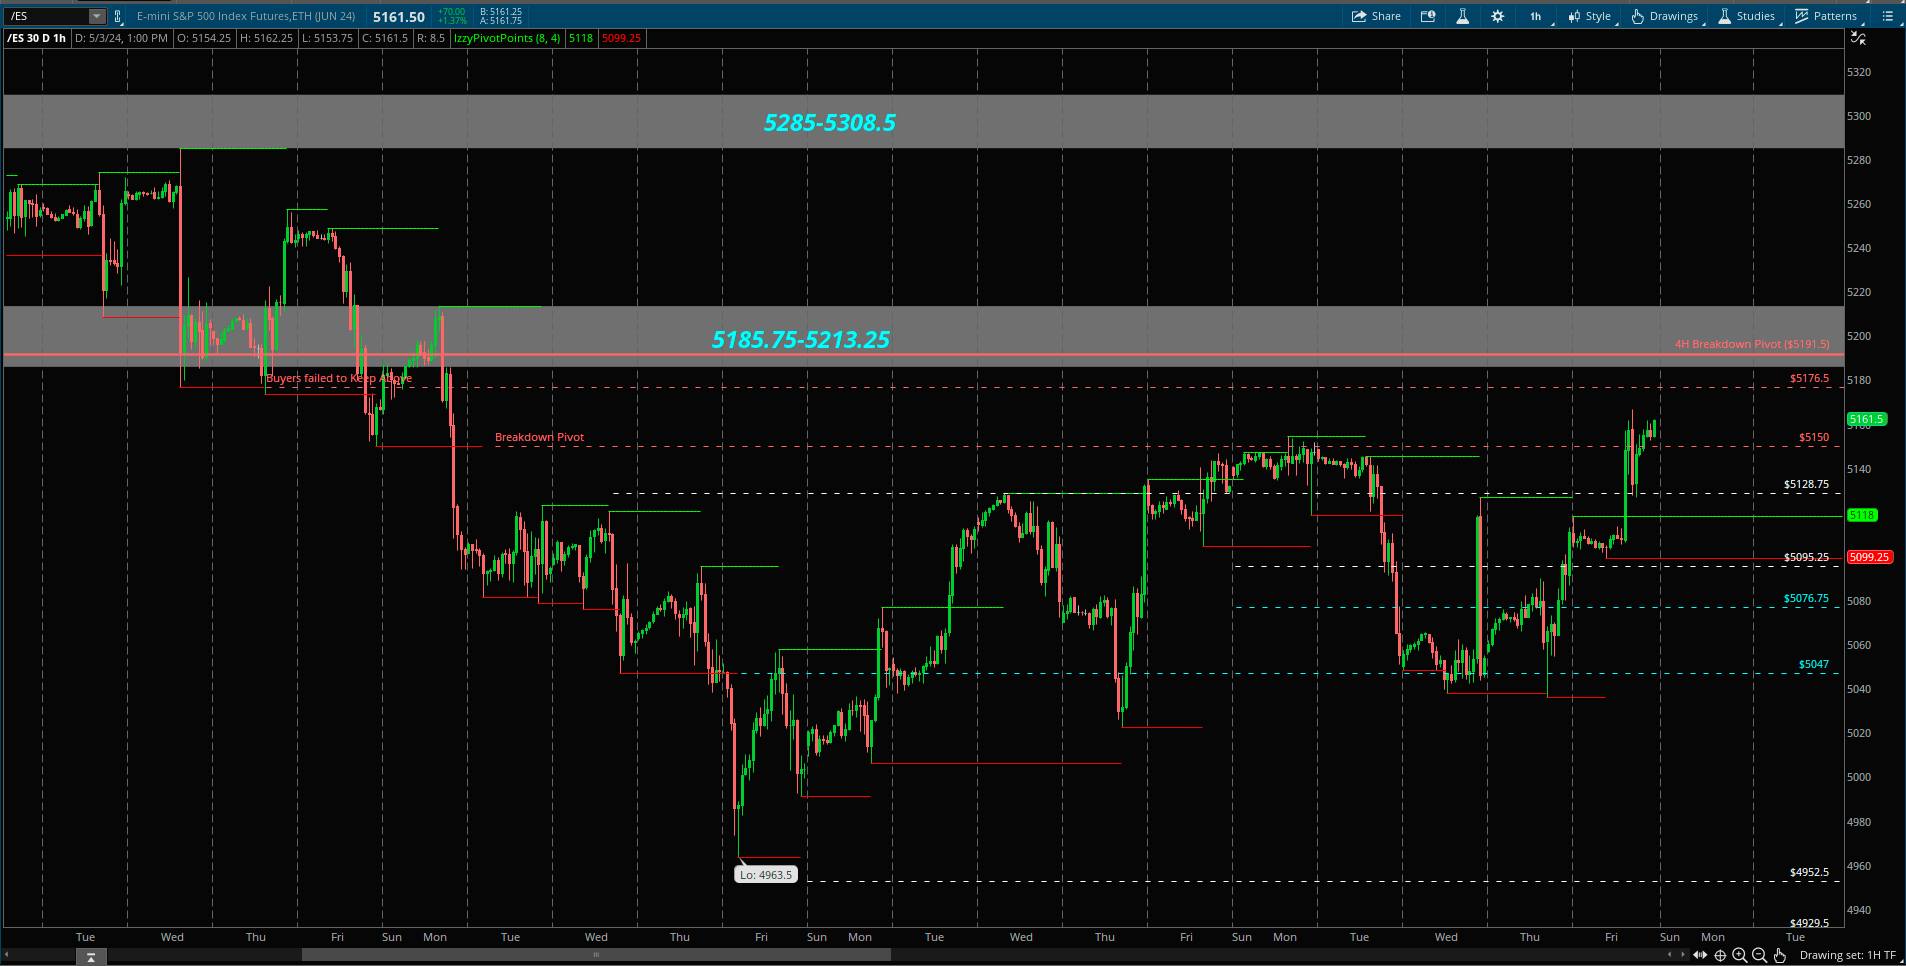
Zooming into the 1H now, just gives us a little more detail on the upside levels we are approaching along with the previous buyer/seller zones based on the prior 4H 5308.5-5191.5 range.
5154.25 is the upper pivot of the 4H range and as mentioned above in the 4H Timeframe section, buyers are exploring to go higher as long as that level can hold. And higher means 5176.5 and the prior buy zone of 5185.75-5213.25 that failed to find demand which sellers capitalized a 222 point breakdown in April.
Sellers control 5185.75-5213.25 on a bigger timeframe view and any rallies into this zone run the risk of getting smacked down quickly.
Failing to hold over 5154.25, 5120-5118 is the first area of support buyers want to hold to keep upside in play. I’ll dive into this more in detail below in “Playing Field Section”.
5099.25 is the short trigger back down into 5076.75/5065.5/5047/5037.75/5022.25 4H Lower Pivot
15Min- Playing Field
Time to put everything all together now.
Seller Zone 5185.75-5213.25 (4H Breakdown Pivot 5191.5)
Buyer Zone 5104.5-5128.75
Upside
Entering week #18 it was all about buyers attempting to reclaim 5104.5-5128.75 sell zone. We saw sellers step in here at 5104.5-5128.75 Tuesday session which put the market back into 5037.75-5065.5 and still was met with buyers rallying right back up which then was followed right back down with sellers the same session (Wednesday).
Into Thursday, sellers attempted to step in once more triggering a move right into 5037.75 support which was met with buyers instantly rallying right back up into 5104.5-5128.75 and into Friday buyers finally cleared this zone putting a breakout above 5154.25 in play.
Moving forward 5104.5-5128.75 is now a buyer zone based on the 15min timeframe.
As long as buyers hold 5104.5-5128.75 it keeps a reclaim of 5185.75-5213.25 in play.
Best case scenario to start off into the week is holding above 5154.25 and trigger straight through 5166.75 to put 5176.5/5185.75-5213.25 into play.
Failing to hold over 5154.25 first immediate support area is at 5128.75-5126.75, as long as this area holds it keep another test back up into 5154.25. I would treat any new longs in this area as a quicker trade as we are coming off a 100+ point day.
5104.5-5128.75 is the zone for buyers to maintain on any sell attempts going into this week to keep upside momentum in play. Revisiting into this zone and as long as it holds it keeps longs in play. Failure of 5104.5 I would be more patient and/or cautious with longs as it puts another trip down into 5037.75-5065.5
5185.75-5213.25, consider this a tough area as it has not been retested since the breakdown of 5191.5 4H pivot was triggered. This is a bigger timeframe seller here. It has been the smaller timeframe (15min) sellers that have been unable to follow through and squeezed out. Bigger timeframe players like to lure in the smaller timeframe traders and this is the reason being I am cautious into this week with longs in this area of the market. I want to truly see how strong the built up demand for the market is here into this breakdown area if we can get into it, and if new interested buyers come in here to continue higher.
Downside
I mentioned this in last weekend’s newsletter.

Here we are getting close into this 5185.75-5213.25 area. What the chart shows us here into 5191.5 is an aggressive seller on 04/15. Fast forward 3 weeks later, is the same conviction there once again on the sells as we head into this week? Or has the outlook changed? I am a price action driven trader and my main priority is to line up and become attuned with the market sentiment in this moment. That requires patience and observation skills.
I would like to see a break above 5185.75 and followed by failure to hold to consider shorts.
If the market fails to push that high into this week, unable to hold 5154.25 is another level I am looking at to consider shorts, but keep in mind it is possible to continue to see buyers defend 5104.5-5128.75
Buyers unable to defend 5104.5-5128.75 the trigger below to get a breakdown going as of now is set at 5099.25 to set up 5076.75/5065.5-5037.75/5022.25

Video Breakdown Of this Newsletter
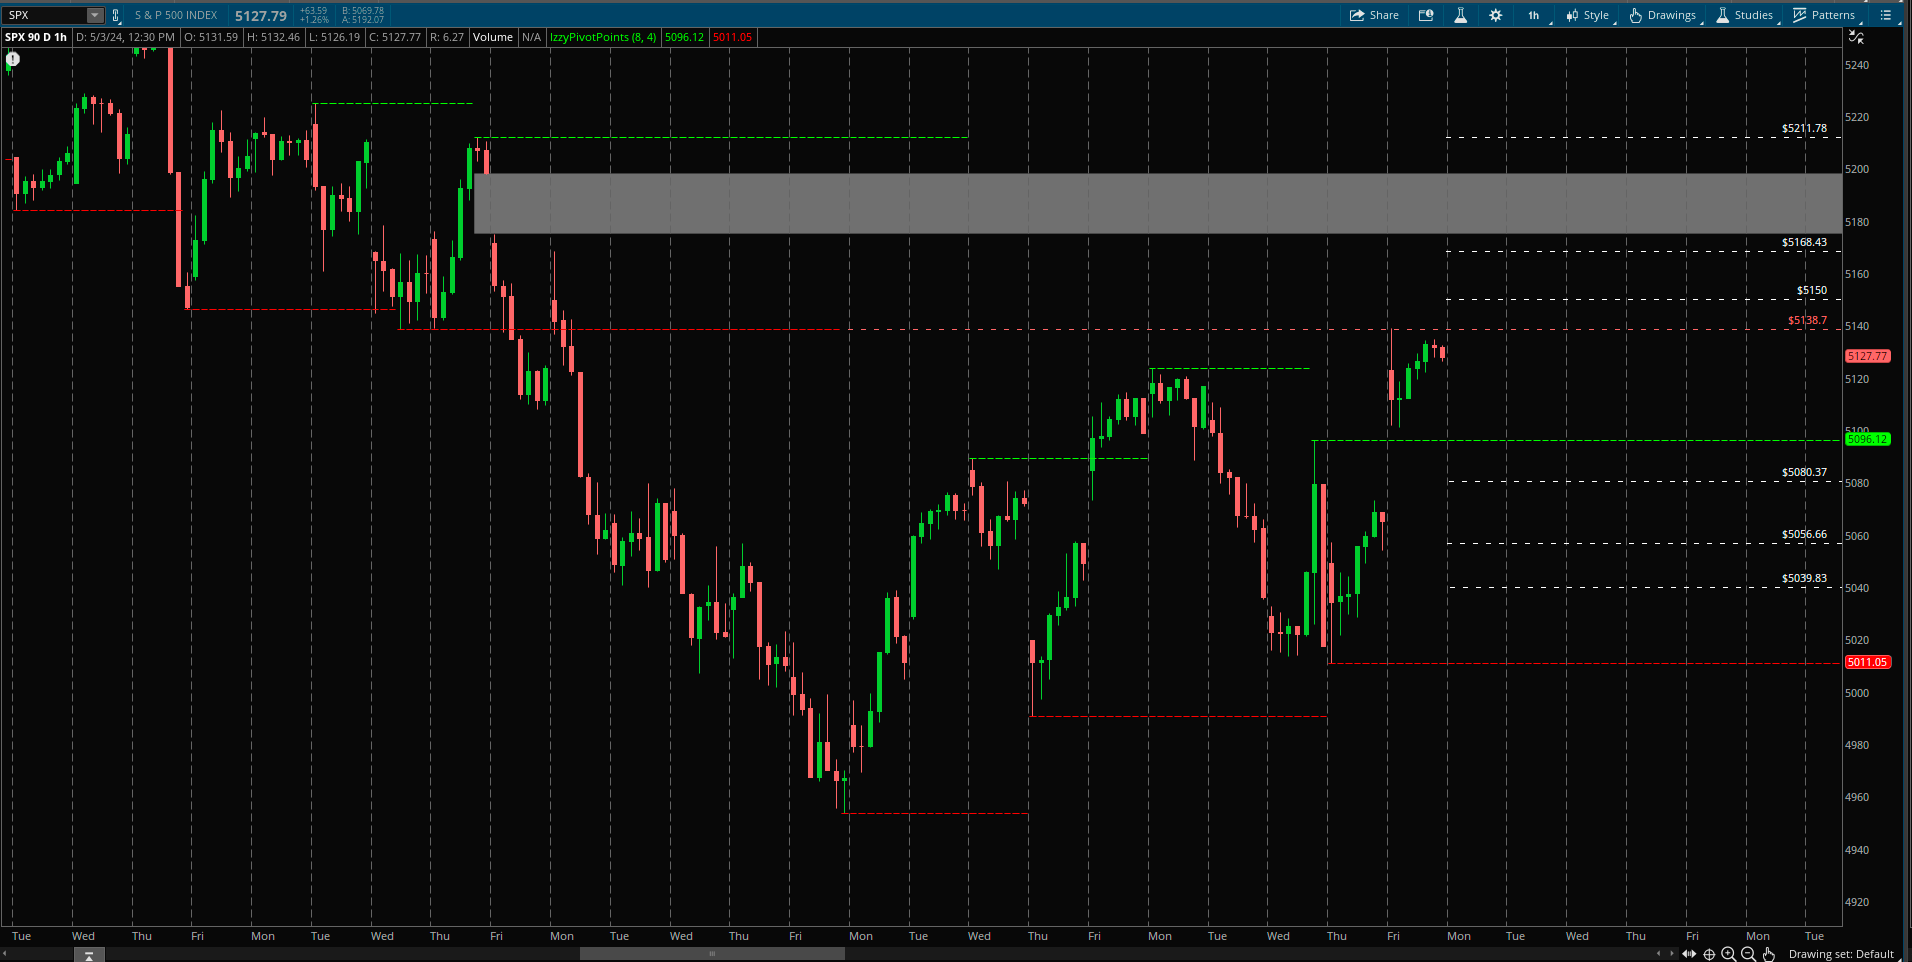
SPX LEVELS
Previous Breakdown Range- 5211.78-5138.7
It is best for SPX to hold above 5096.12 to keep a move over 5138.7 in play. Targets I would be looking for over 5138.7 are set at 5150/5168.43/ gap fill above 5175.03-5197.99/ 5211.78
Failing to hold above 5096.12 suggests the attempt to break higher failed and possible to remain trading within the the range of 5096.12-5011.05, in this scenario below 5096.12 I would be more patient on longs and wait for support 5011.05-4990.58 unless 5096.12 can be recaptured and hold.
Below 5096.12 there is also a gap we saw into Friday. Failing to hold above 5096.12 we run the risk of filling this gap below.
It is possible to see consolidation within 5138.7-5096.12 before we see a bigger move. 5096.12 is the key level for buyers to maintain over to upside in play early into May