

ES Plan Week #17
ES Plan Week #17
I update via X based on this plan as the market session unfolds in real time. Make sure to follow for the real time market updates! X (Twitter)- trader_izzy

Recap of Week #16
We started off last week with zooming out and looking at the widest timeframe, being the daily and asked whether we set up for the upper pivot [5333.5] or the lower pivot [4929.5]?
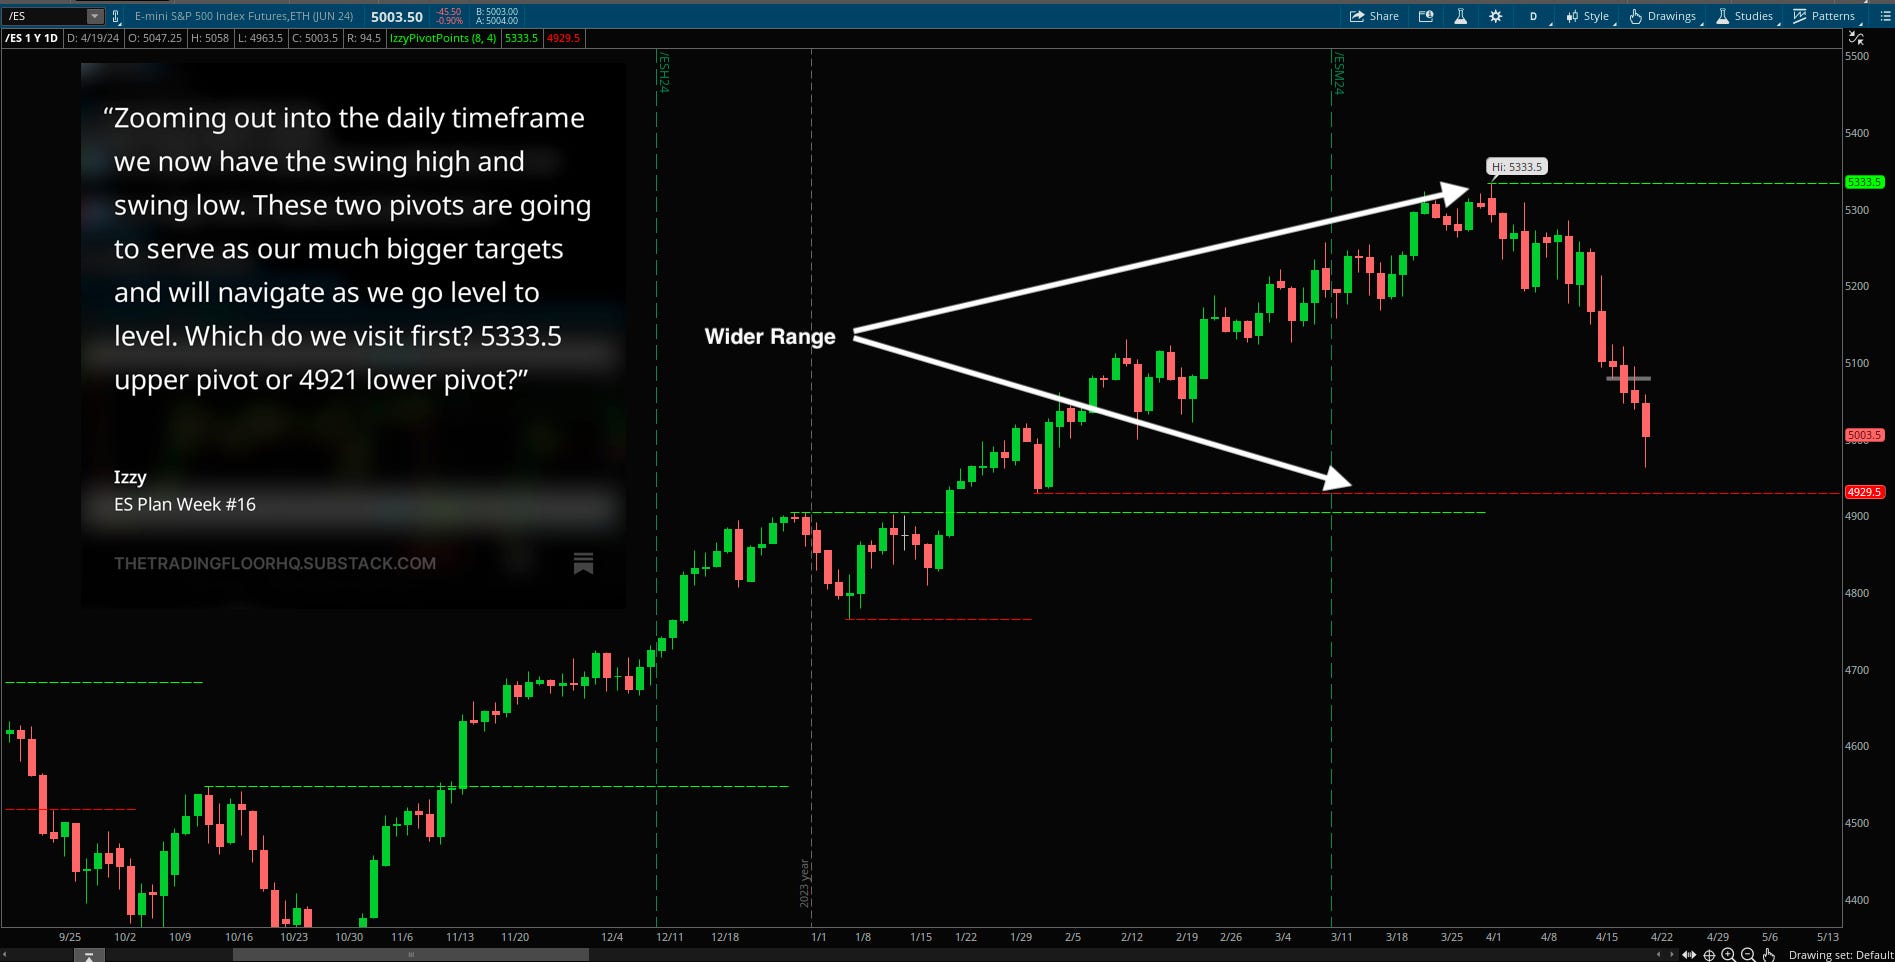
Closing out the week market headed south nearing into 4929.5, how did we set up for this?
The main range we were trading in from 04/04-04/12 was set at 5308.5-5191.5 and as we entered this week sellers had already put in an attempt to breakdown the major support/short pivot of 5191.5 the previous Friday session (04/12).
This made 5191.5 an important level at the start of this week. Would buyers be able to reclaim on a retest? Failing to do so and remaining below would show us lack of buyers within this area of the market and we would begin looking for expansion into the 5000-5022.5 and ultimately 4929.5 lower pivot.
The set up into Monday was very straight forward. Hold above 5150 to trigger through 5173.5 that set up a retest of 5191.5.
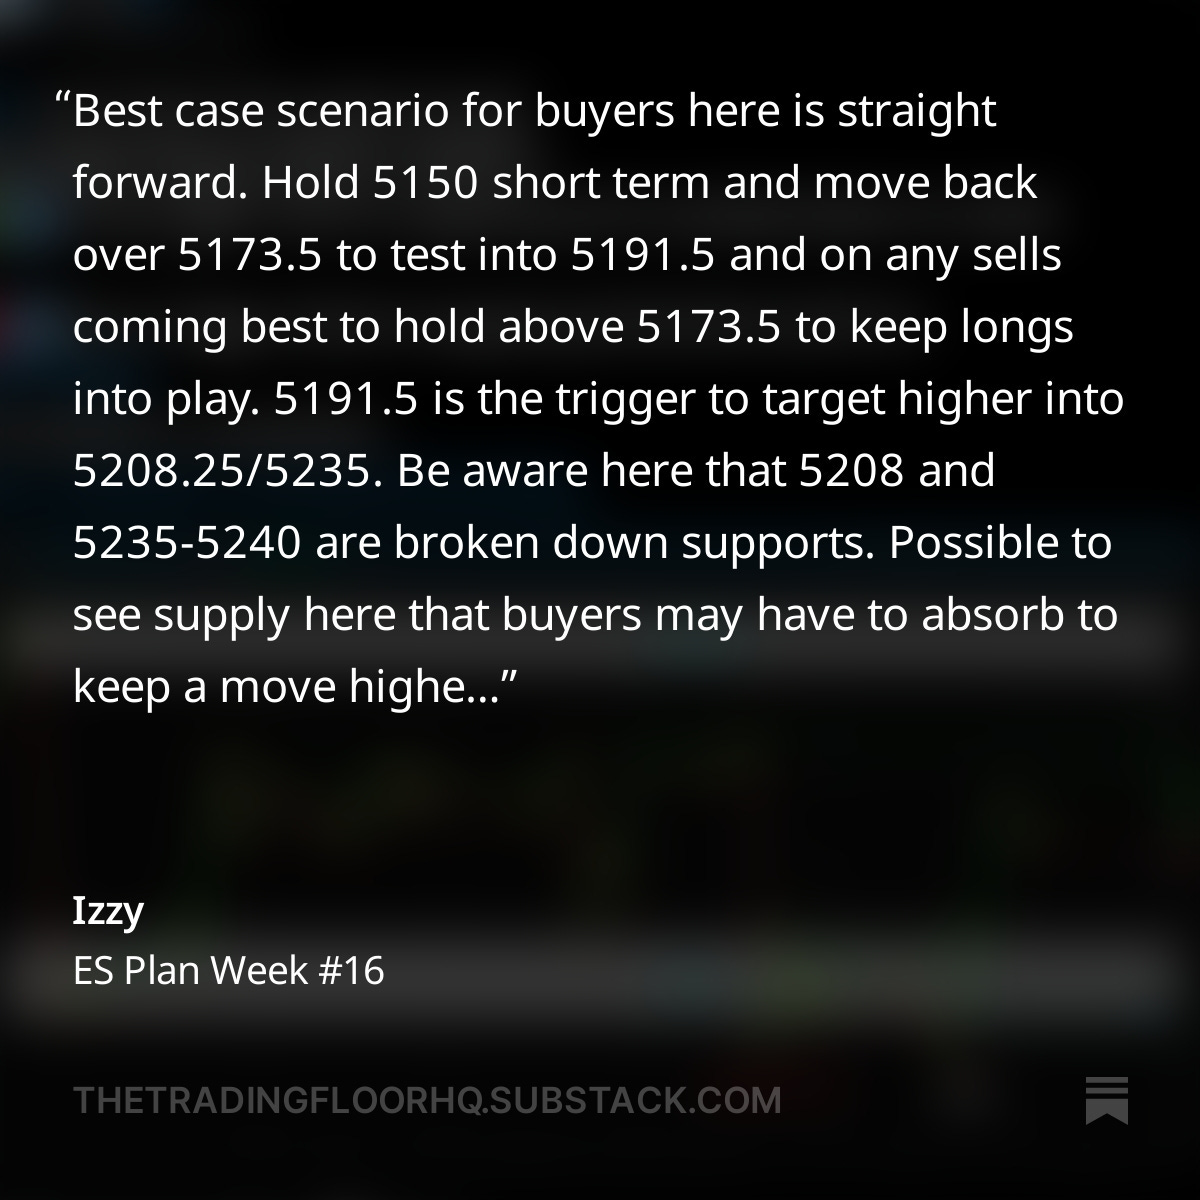
Longs were paid overnight heading into Monday cash open, but this quickly reversed. I advised about two overhead supply zones being 5208 and 5235-5240. Sellers proved quickly to be at 5208 and moved the market back down through 5191.5/5173.5 and breaking below 5150 to begin the lower highs and lower lows sequence into this past week. The attempt to reclaim back over 5191.5 was rejected and as I mentioned would indicate further market weakness setting the tone for this past week.
I talked about adjusting to price in the downside risk section of ES Plan Week #16.
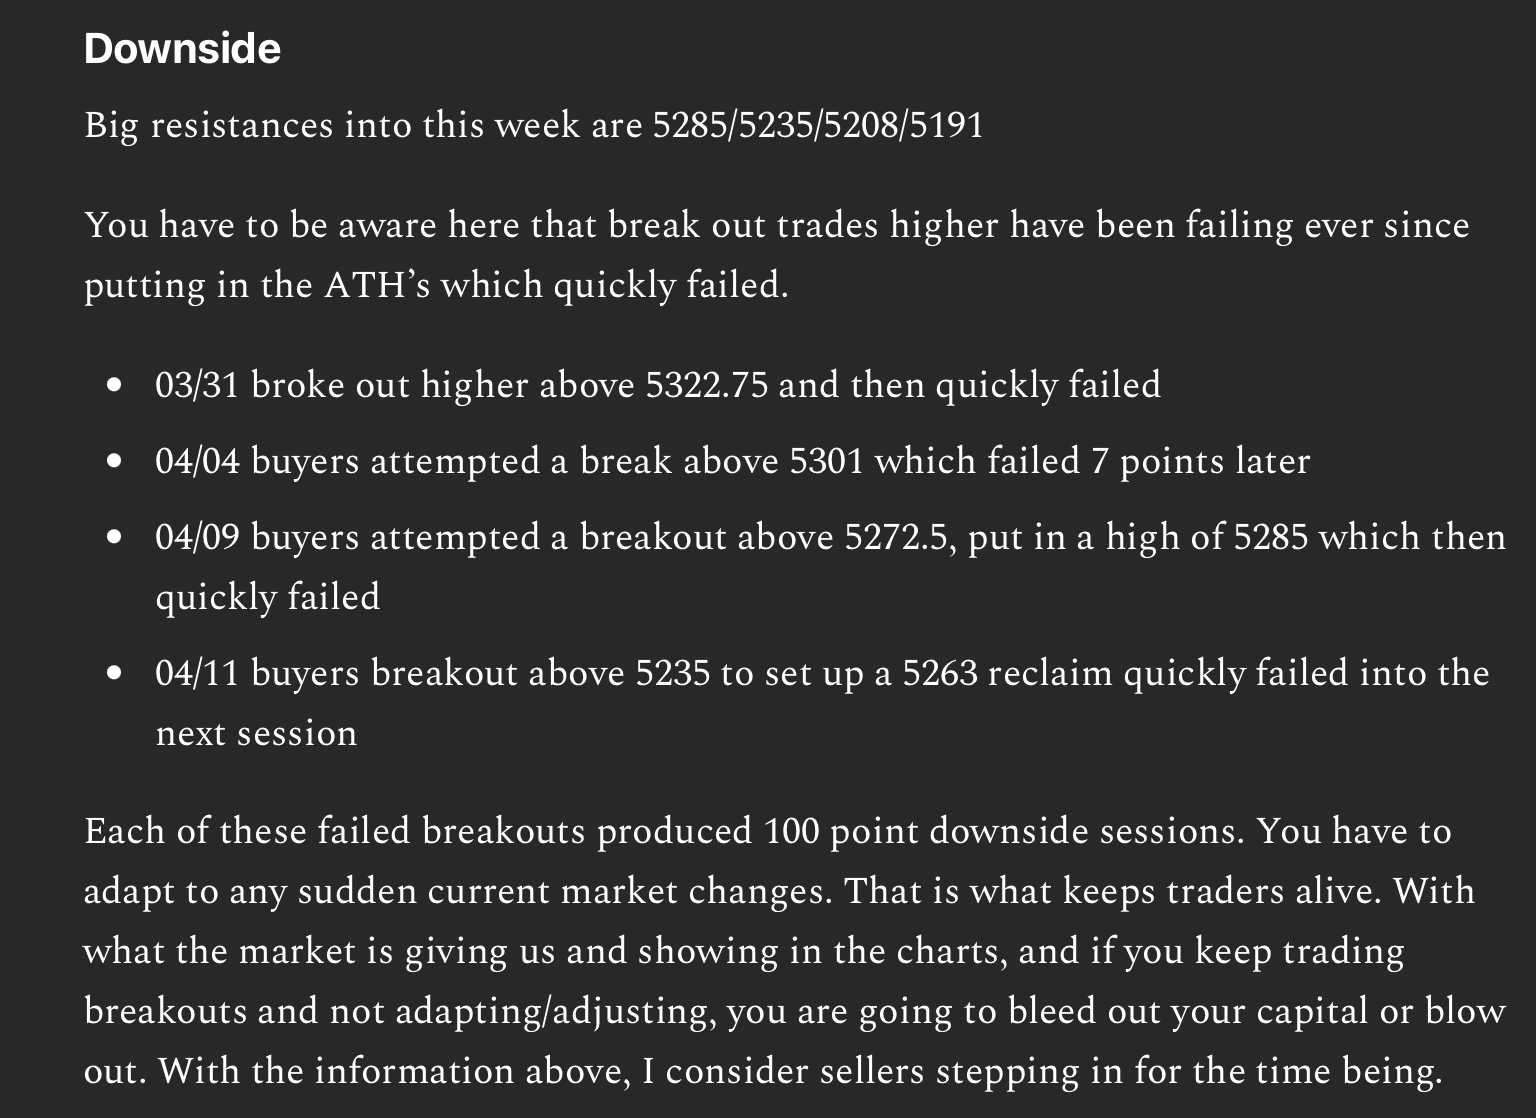
After Monday’s attempt to move higher and ending the session lower, the rest of week was no different. Every session into overnight attempted to move higher but finished the session in the red or with new lows.
The faster you can recognize and adjust/adapt to the price action results in better risk management decisions coming in allowing us to manage any losses and follow the market correctly on the opportunities brought to us. Change or Adaptability in any domain in life is difficult and a skill to grow and build. Being closed minded, not being flexible especially in the markets will keep your potential small as the market environments are always in constant change, especially as you zoom into smaller timeframes where the margin of error is so small and comes at you fast.
Heading into this week, we are coming near a significant area of support and nearly down 300 points from the ATH we put in on the 1st day of this month we are about to finish up. Let’s get into how we will navigate level to level, session per session, welcoming any sudden changes and reacting to them as a day trader should be.
Daily Timeframe Pivots 5333.5-4929.5
Major Support Levels To Know
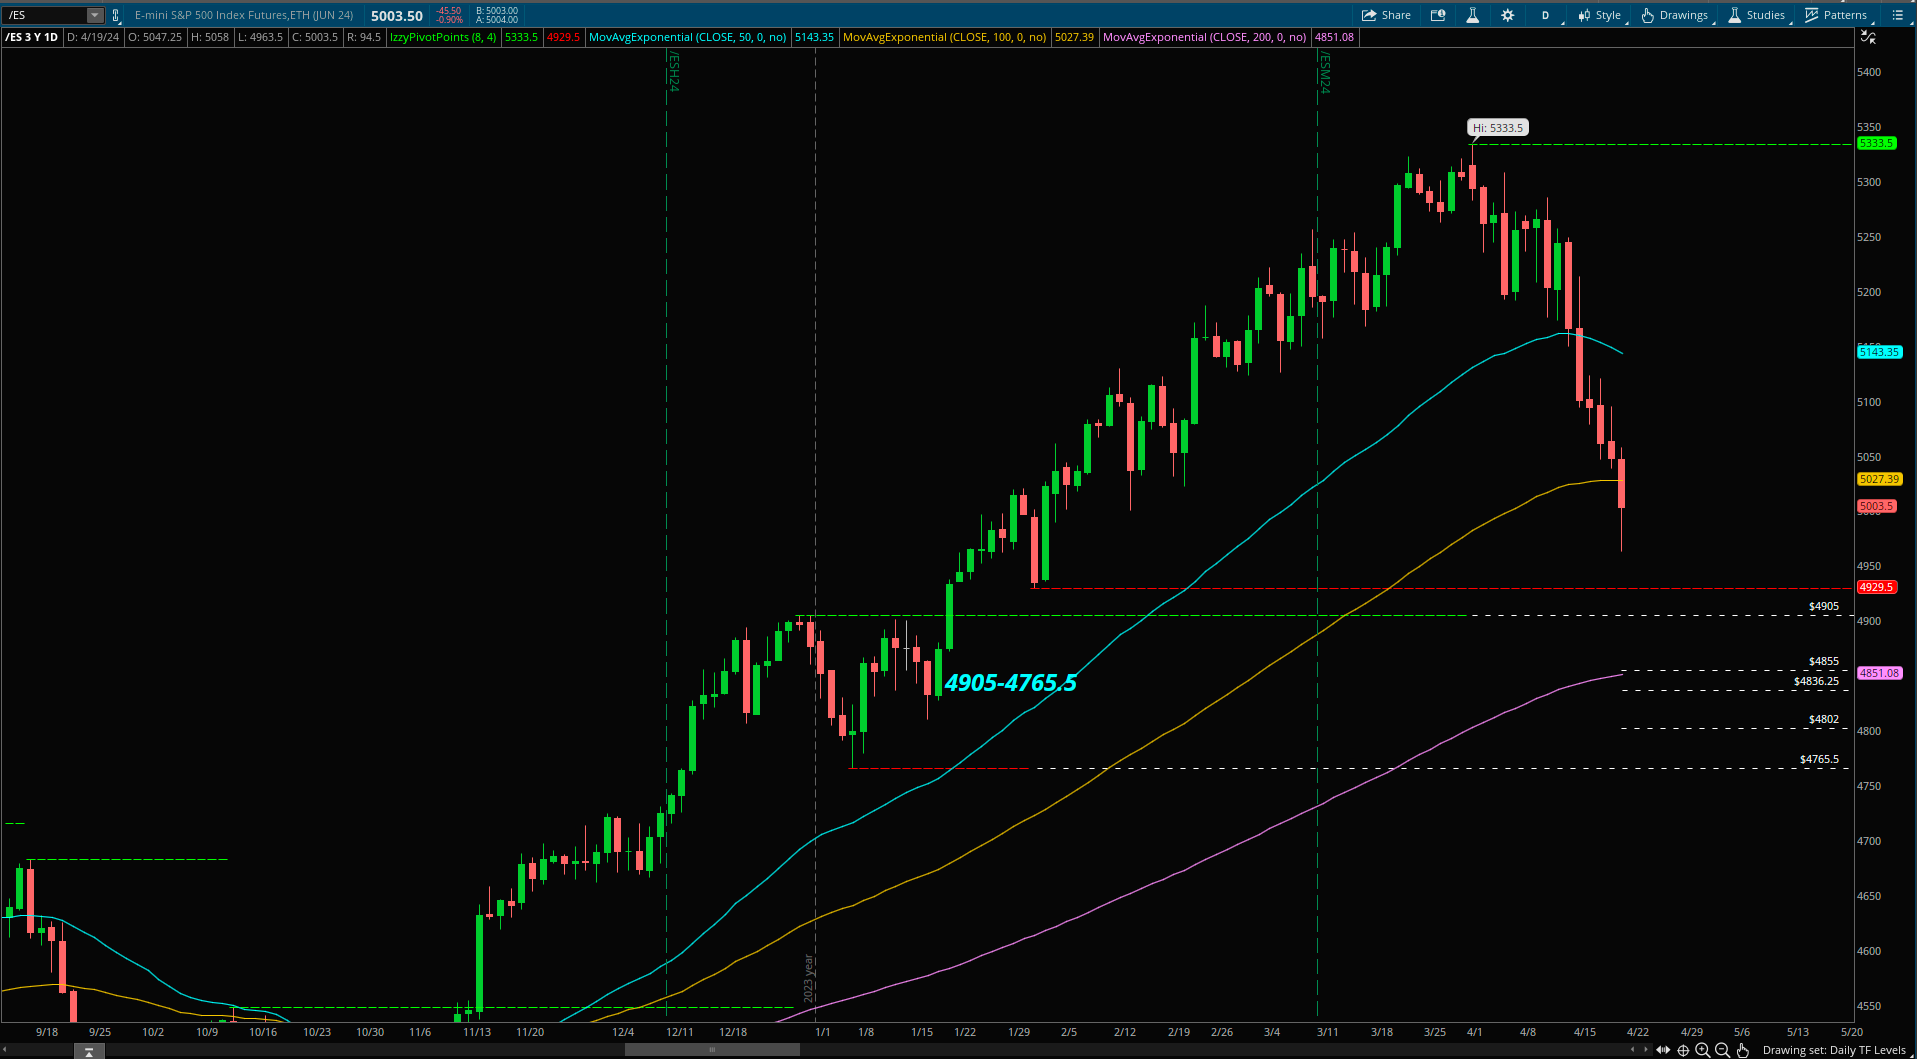
4929.5- Lower Part of the Daily TF Range
4905- Jan Breakout Trigger that moved the market higher
4802- Adjusted 2023 ATH before we saw the correction in July- October 2023
Let’s zoom out here and see the bigger timeframe direction.
One of the main focus into this week is the major support we are nearing being 4929.5 that hasn’t been fully tested just yet and basically intact. Right underneath this 4929.5 support we have a range the market was basing into that led the break/grind higher into the start of the year all the way into the recent ATH’s being 5333.5, and that range is 4905-4765.5. We are nearing pretty good support zones and levels, question is… are buyers interested here? We need to see some activity rather than trying to catch a falling knife as there is no sign of a bottom just yet.
As long as buyers can hold over 4929.5 it keeps the market within this wider range. 4929.5-4905 is that overall downside zone I am watching to hold to keep longs in play keeping 5333.5 alive as the longer term upside target.
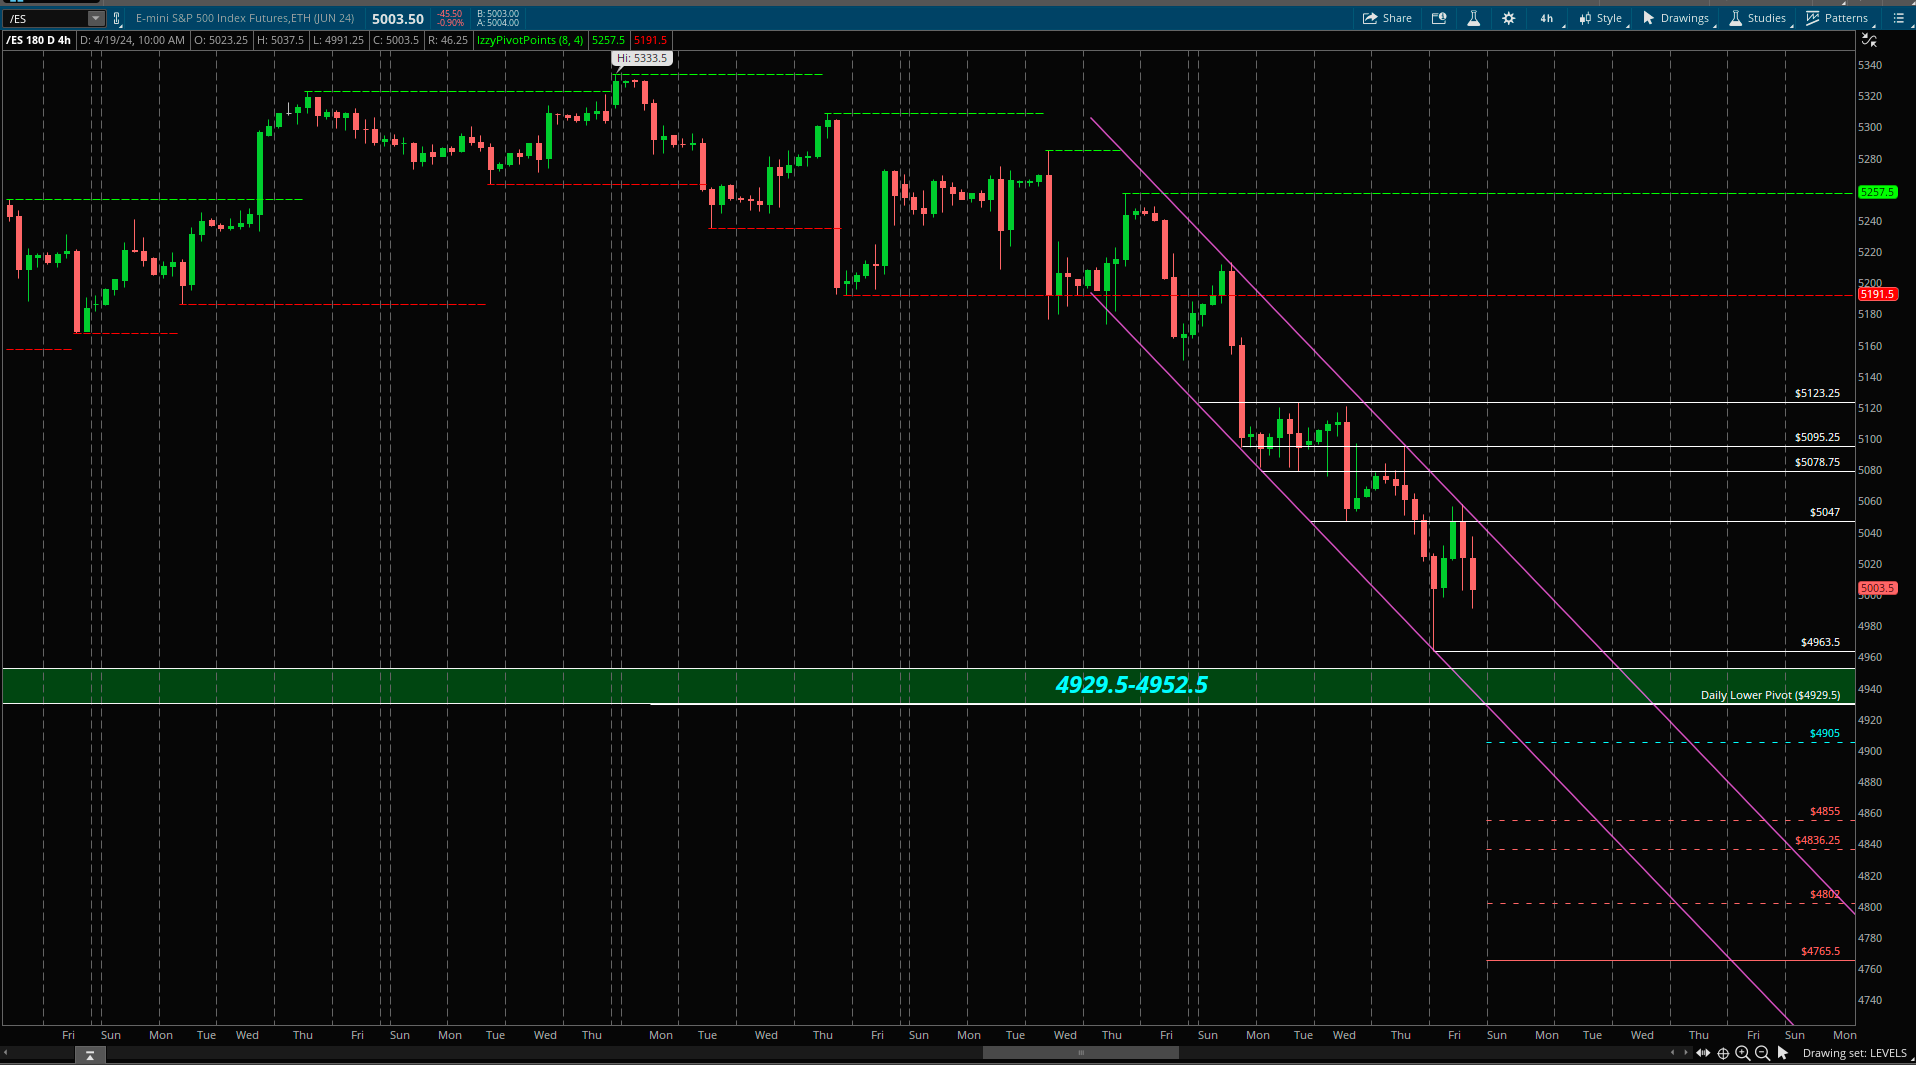
4H Timeframe Range Pivots 5257.5-5191.5
The failure of 5191.5 short pivot triggered a sell expanding the market lower into the daily time frame lower pivot of 4929.5 and nearly came close to it in the after hours sell off of Thursday putting in a low of 4963.5.
Since that 5191.5 short pivot break, clear to see the 4H has been putting in lower highs followed by lower lows with still no confirmed sign of a bottom here yet as we approach these support levels of interest pointed out above in the Daily Timeframe section.
5047 is the most recent breakdown support level which triggered in the after-hours of Thursday session heading into Friday. Buyers stepped in at the lows of 4963.5 and attempted a reclaim back over 5047 which was rejected intraday but held well above Friday’s low as of now.
These are the scenarios I am looking into this week which revolves around 4963.5 low of last week.
Breaking below 4963.5 we start to look for the direct test of the Daily Timeframe lower pivot at 4929.5. Failure of 4929.5 triggers a steeper sell targeting 4905/4855/4836.25
If buyers can defend 4963.5-4973.5 (intraday buy zone that I will go over below), it keeps a reclaim of 5047 in play which we start to look for a bottom to trade off of to give momentum into longs.
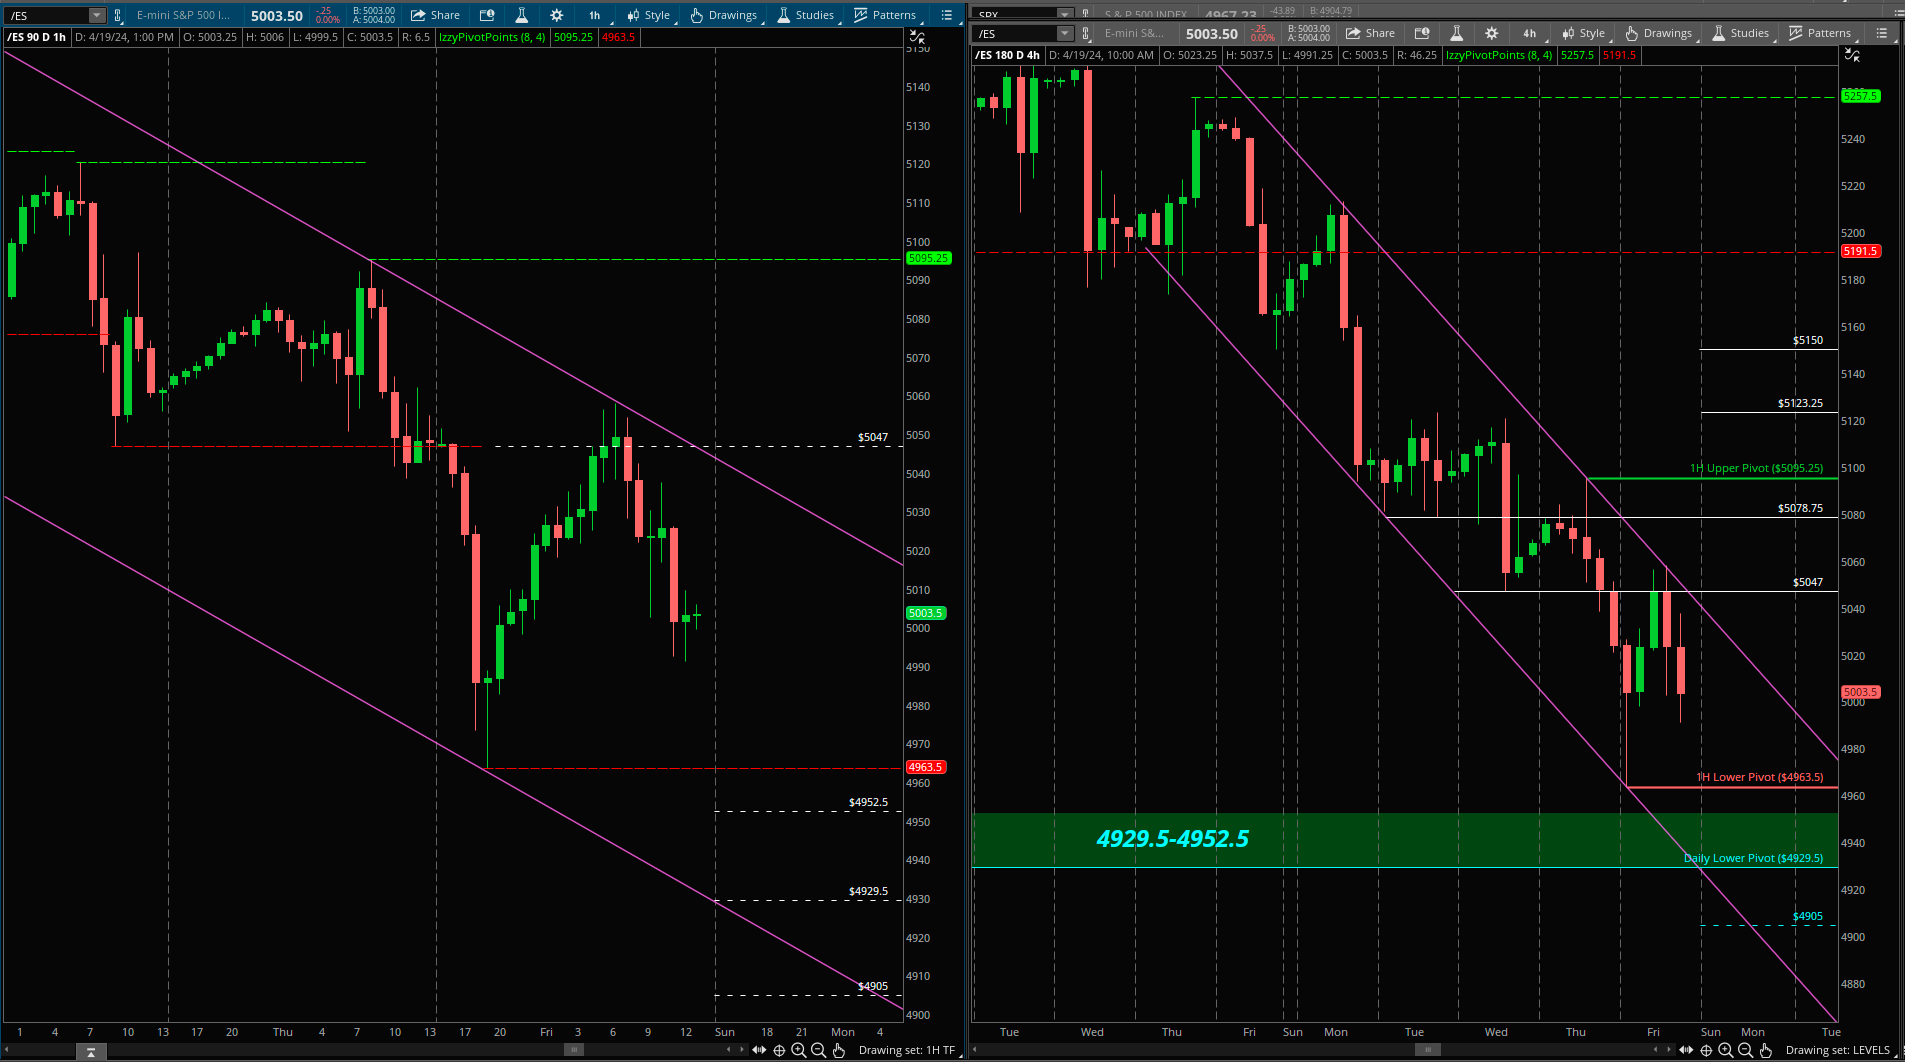
1H Timeframe Range 5095.25-4963.5
So far…
We know we are approaching the extreme lows of the Daily Timeframe Range-4929.5
We also know the trigger that got us trending into the lower part of the much wider range (Daily) was the breakdown of 5191.5 (from the 4H) and the market has been trending with lower highs followed by lower lows still.
Now zooming in one timeframe lower (1H), this gives us the main intraday range of focus to guide with short term direction, 5095.25-4963.5 with 5047 being the recent breakdown support level
Anything within this range is all consolidation and possible we can remain here before making another move.
Buyers need to break above 5095.25 to set up 5123.25/5150/5191.5
Failure of 4963.5 we look for continuation lower targeting first zone 4929.5-4905. Unable to hold 4929.5-4905 it triggers a sell targeting 4855/4836.25
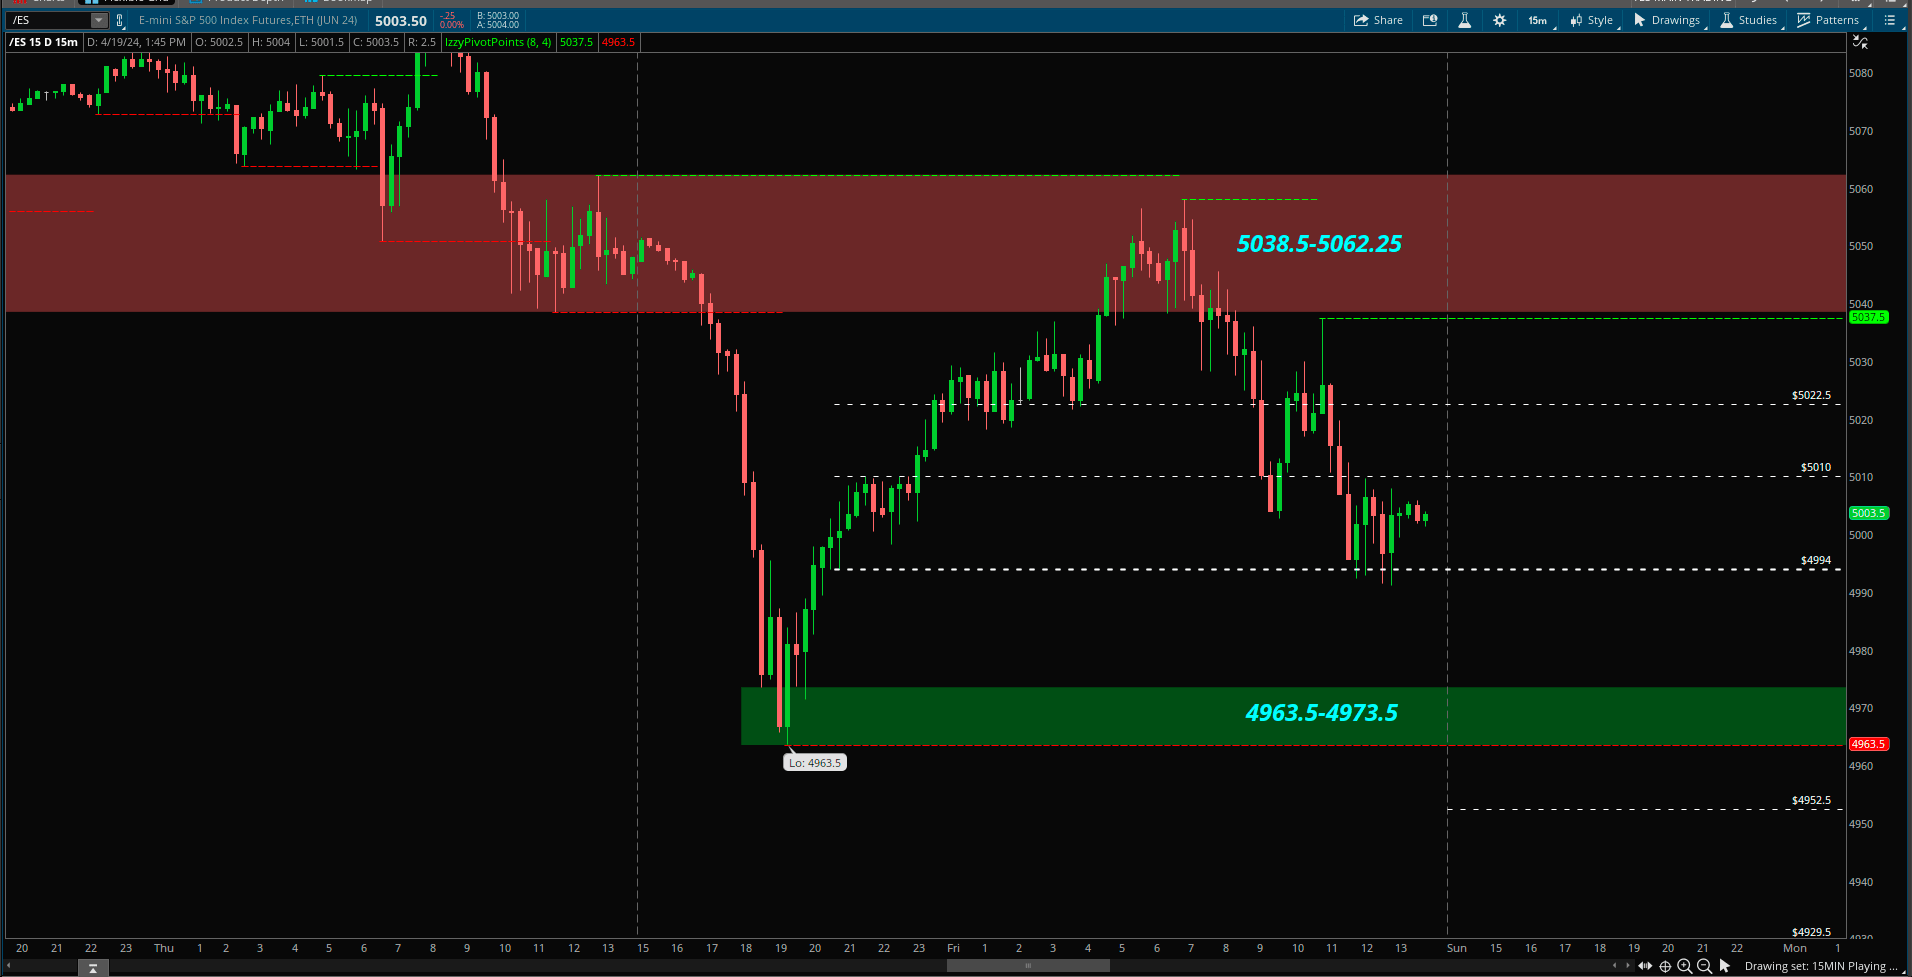
Playing Field- 15Min
Putting it all together now…
Daily Timeframe gives us the wider range the market is in as of now
4H Range gave us the trending move into the next bigger timeframe pivot
1H Range will give us short term direction whether the market wants to retest back into 5191.5 or we fully set up to test 4929.5-4905 lower part of the Daily Range
As readers know, 15min is the lowest timeframe I go down into to watch development into 1H, which then develops into 4H and into the Daily.
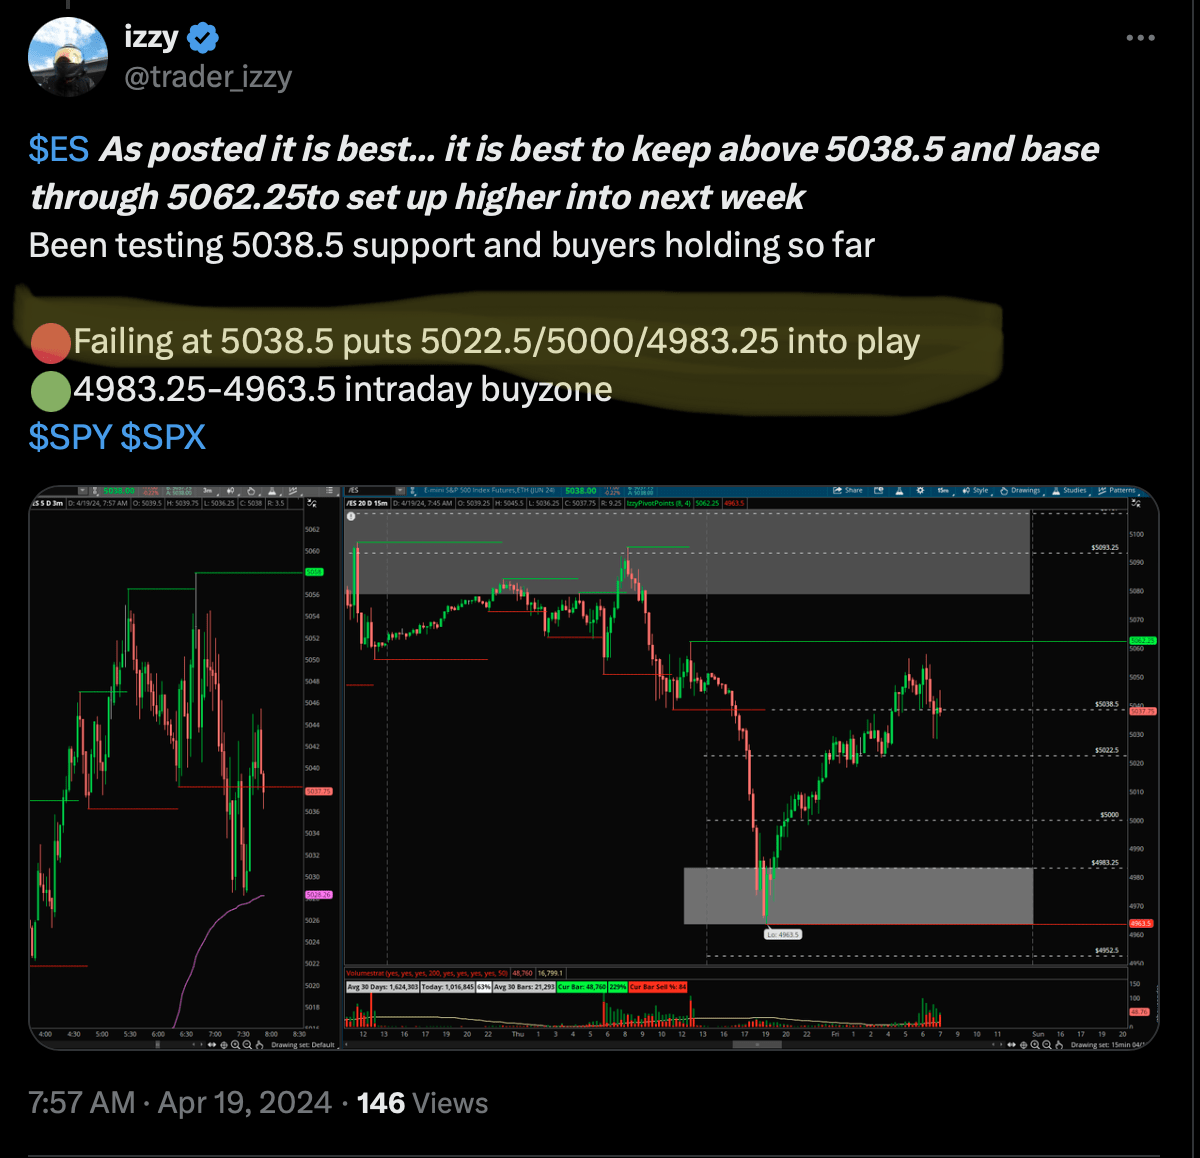
Seller Zone 5038.5-5062.25 (where I look for shorts)
Buyer Zone 4963.5-4973.5 (where I look for longs)
Upside
The main objective for buyers here is hold above current intraday support zone of 4963.5-4973.5 to put 5038.5-5062.25 into play. Sellers control 5038.5-5062.25 as of now and so far into Friday we saw sellers step in rejecting buyers from reclaiming this area as of now. Buyers need to reclaim back over to attempt a move higher, until then move with caution.
Best case scenario here is we see buyers defend 4963.5-4973.5 without seeing any dips below to see another retest back up into 5038.5-5062.25. Seeing this play out it would be best for buyers to consolidate within 5038.5-5062.25. If we do revisit back into 5038.5 and see sells trigger, we want to pay attention to them. Are they holding higher lows? Are they less impulsive? Are they bought up quicker? 5062.25 is the trigger to set up a move into the upper 1H pivot- 5095.25.
If we test back into 4963.5-4973.5, spike below 4963.5 but reclaim back over quickly, this is my signal to attempt longs with the scenario that we remain within the 1H Pivot Range. You have to be mindful here with this, every reclaim attempt since 5191.5 has failed but we are near the Daily Timeframe lower part of the Range. Buyers have to show us something different.
If sellers manage to breakdown 4963.5 1H pivot, I am not too much of a fan of chasing that breakdown due to being near the Daily Lower Pivot- 4929.5. That is a level I will be watching on further market weakness to see if sellers fail to follow through below. If so, this puts longs into play.
Downside
We saw buyers step in at the lows of 4963.5-4973.5 in Thursday after-hours which set up a retest of the breakdown area of 5038.5-5062.25 into Friday session. Sellers still showed up showing us activity here and so far rejecting buyers. This put shorts into play and best entry if taken.
Into the beginning of the week, sellers look to target into 1H lower pivot off this rejection of 5038.5-5062.25. In testing backdown into 4963.5, can sellers follow through below? Keep in mind, this is a breakdown trade of a support level. As readers know, I like to be positioned already, taken 3/4 profits and trailing a runner into these set ups to see if there is continuation out of the 1H range or not. Looking for a breakdown (breakout in upside) are high risk/low probability trades ESPECIALLY entering with a new position. Just have to be mindful of risk management.
Breaking below 4963.5 as mentioned the market looks for continuation lower targeting 4952.5/4929.5/4905.
Now, we’ve gone over the much wider range pulled from the Daily Timeframe and we are approaching the lower part (4929.5) if 4963.5 breaks down. If sellers get this scenario to start off the week and fail to follow through below 4929.5, it can set up a short squeeze. Have to be mindful of this risk.
Below 4929.5 triggers a steeper sell into 4905/4855/4836.25
Short term sellers are in control from the breakdown of 5191.5 and putting in lower highs followed by lower lows with no sign of this stopping yet. Have to understand this when considering longs, can’t front run when the charts are showing you something else. Also here is the other side of the coin, we are approaching areas that may catch buyers - 4929.5
Due to this, being patient and observing into Monday are going to be very important psychological skills to practice to set ourselves up. I navigate the market the way I explained it above from finding the bigger timeframe targets and zooming into the smaller timeframes to find entries and stay objective on direction. My long/short signals to execute entries come from the market trapping participants from a failed breakdown/breakout. That is what I solely focus into when price is approaching the zones/pivots we just went over. EVERYTHING else is noise. The more your focus and attention gets dragged into the outside noise which can be… any news headline, other people analysis and ‘predictions’ whether its a bull or bear market, the weaker the focus and attention becomes on the signal. It is the outside noise that alters or triggers an emotional state, which then depending on what that emotion was, dictates your thoughts and perception. If you are not aware of your emotional state this is where you get hijacked. Based on that perception you created for yourself is what you then act on. This is mindlessness and it can be very dangerous in trading. Trading requires discipline to stay on your plan and not act outside of it. Patience to wait and focus on your signal. And a clear state of mind, to not have judgement of the present moment in the market and react of the possibilities unfolding within the moment rather than acting out of fear, or impulsive behaviors.