

ES Plan Week #25
ES Plan Week #25
I update via X based on this plan as the market session unfolds in real time. Make sure to follow for the real time market updates! X (Twitter)- trader_izzy

Here is previous weekend newsletter if needed for any review or catch up.

Moving forward here we are rolling over future contracts into the September one now. Ticker is /ESU24 on TOS, or /ES alone does the adjustments for you.
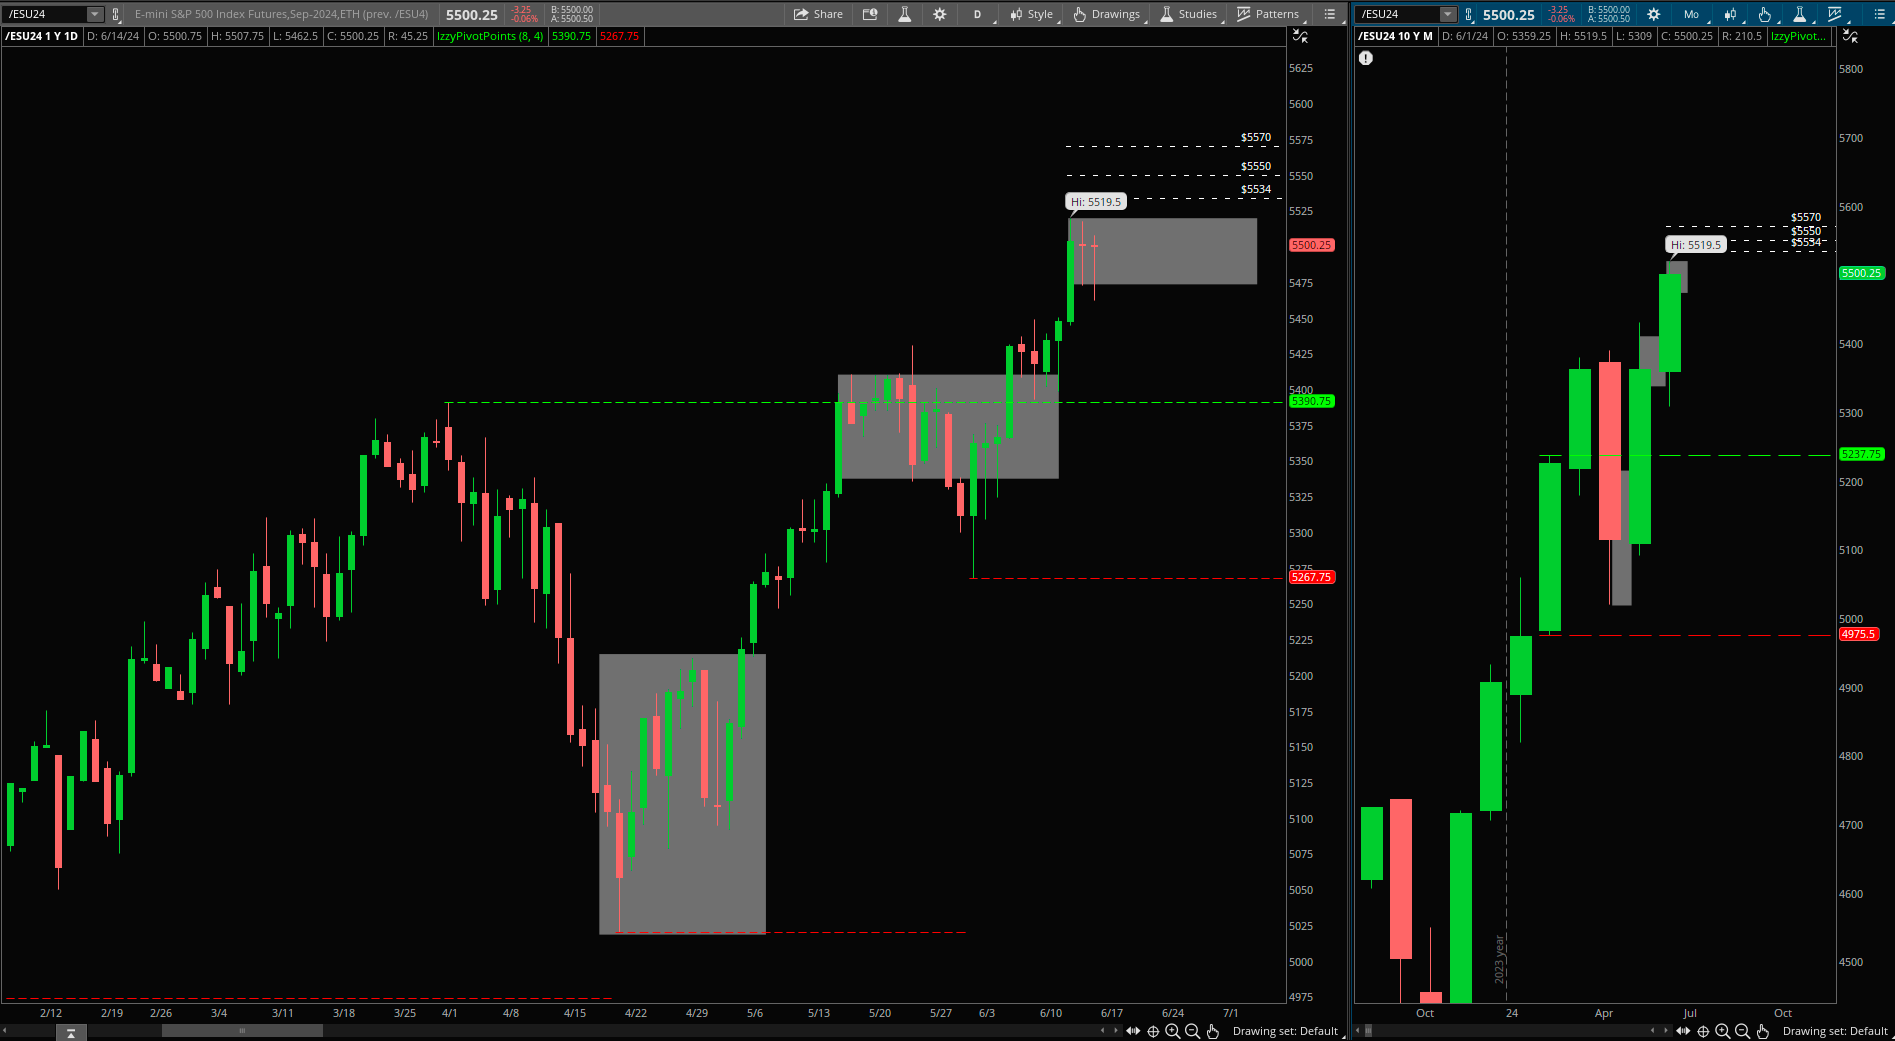
Daily Timeframe Pivots 5267.75-5390.75
Let’s do some reviewing here.
Zooming out a bit onto this higher timeframe to see this bigger picture. 5390.75 is April’s 2024 high that was put in right before the market went on a 400 point downturn into the month of April.
From setting the April low’s on 04/19/24 near the daily lower pivot, the market rallied right back up hitting 5390.75 level right on 05/15/24. I went ahead and tweeted this via X after hitting 5390.75 level (on the June contract is 5333.5)

Testing for the 1st time right back into 5390.75 [5333.5] I advised not to be impulsive and chase longs as we can see some type of resistance there and would be best to see a pause in the market to set up a higher low to trade.
It was on the newsletter of ES Plan Week #22 that I advised the set up on the downturn of rejecting 5390.75 [5333.5] daily pivot which was fulfilled and led right into a major buyer zone… 5285-5246.75 (on the June contract it is 5188.75-5218) that set up the higher lower to retest back into 5390.75 and look for the next leg attempt higher.
Which brings us into this week’s plan….
The first thing to understand here is, in a bigger timeframe view, all the market has been doing is trading within a wider range of 5020-5390.75. And this past week, buyers are attempting to put in another leg higher out of this 3 month range.
Here are the two scenarios I am looking at. As always scenario (A) is always sticking with the primary trend and with (B) being the counter trend move.
(A) Upside Scenario- Triggering through 5519.5 targeting upside targets of 5534/5550/5570
(B) Downside- Failure of 5473-5462.5 support puts downside targets of 5449.25/5390.75-5398.75/5267.25
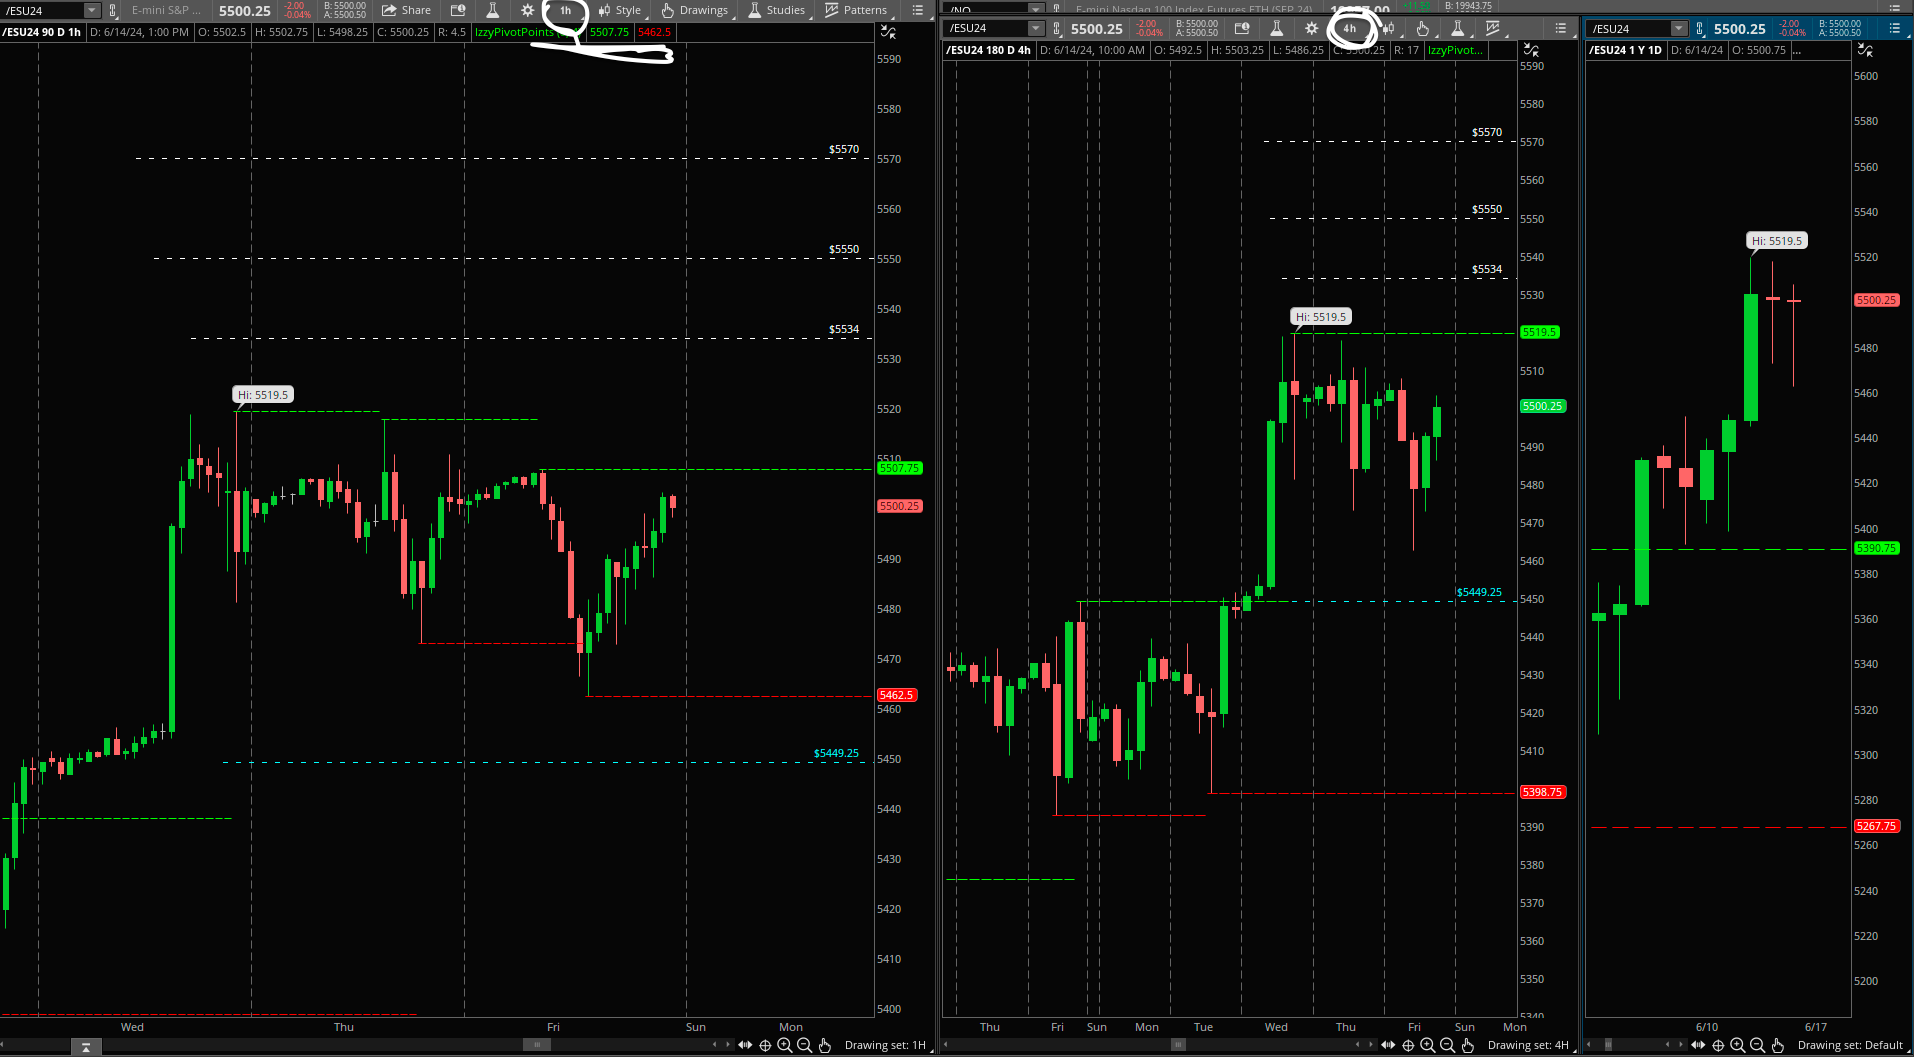
1H and 4H Timeframe
4H Range 5398.75-5519.5
1H Range 5462.5-5507.75
With Daily time framing up higher above 5390.75 pivot out of a 3 month consolidation, going to zoom in onto these two smaller timeframes to stay objective into what scenario is in play.
Wider range of focus is pulled from the 4H range being 5398.75-5519.5 along with the mid pivot being 5449.25.
The compressed range from the 1H 5462.5-5507.75 is the range of focus to kick off this week.
5507.75-5519.5 is a zone buyers must reclaim intraday to set up a breakout attempt targeting 5534/5550/5570
5473-5462.5 remains the first area of intraday support. Failure of this zone gets scenario B started and we began looking for possible expansion into the next higher timeframe lower pivot being 5398.75 (4H timeframe). This would just expand the trading range here.
5398.75-5390.75 is an important zone for buyers to hold if we come to see this. Failure of this much bigger area, in the perspective of a longer term view, is what puts the daily lower pivot of 5267.75 on the scope.
Trading within 5519.5-5462.5 is all consolidation and possible we can remain to do so before setting up a bigger move. As I have mentioned to readers many times, the market does 2 things only. Trend and consolidate.
The market will compress in volatility (consolidation), build up energy like a spring to then set up decompression (trend) of the built up energy causing volatility. The market spends most of its time in a consolidation state, trapping participants both on upside and downside various times before making a move. And this trapping right here, is what I thrive on to find entries both long and short, and locking in profits level to level that has kept me consistent and profitable throughout my journey. Many, if not most of the participants are always looking to chase the bigger move (breakdown or breakout) for a home run trade, the big win that will change your life. If the market spends most of its time within a consolidation state, it is easy to point out here that these trades should be considered low probability.
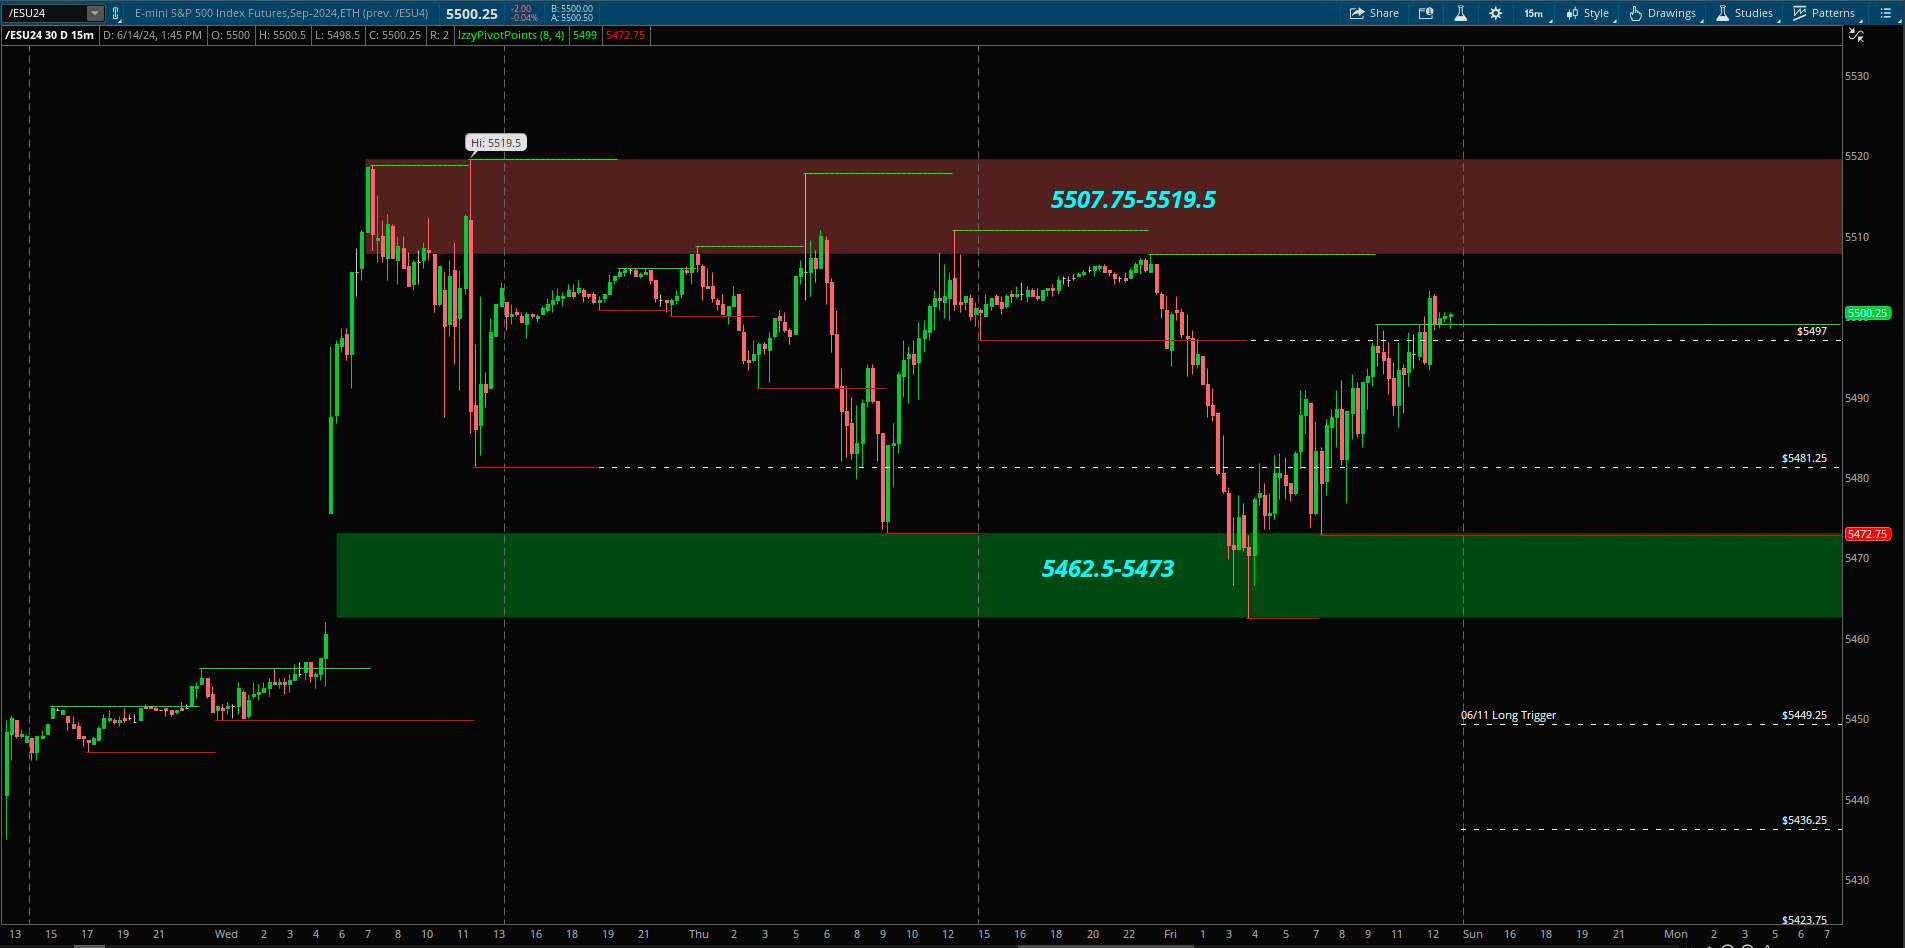
15min Playing Field
Seller Zone 5507.75-5519.5
Buyer Zone 5462.5-5473
Upside
As long as 5462.5-5473 support zone holds, as mentioned keeps scenario A in play. Tested twice so far on Thursday and Friday. First area to look for longs, considering it is lower part of 1H range, if sellers attempt another breakdown and fail to follow through, recapture of this zone is what I want to see to enter long.
On Friday session, shorts triggered overnight at 5497 level right back down into 5462.5-5473 support area, met with buyers to move right back over 5497 before session close.
Into Monday, 5497 is the first level I am looking at to hold to keep a immediate test back up into 5507.75-5519.5, testing into this zone and seeing any sells, the best case scenario involves holding 5497 to keep that breakout higher above 5519.5 in play.
Above 5519.5 targeting 5534/5550/5570
Failing to hold 5497, intraday I would be more cautious/patient with longs as it puts 5481.25 and support zone of 5462.5-5473 once more.
Breaking below 5462.5 the first target lower is last week’s 06/11 breakout 4H trigger 5449.25. This is a level I will be keeping eyes on to see how it acts on a retest if it were to come.
Overall the bigger level I would be cautious with is at 5462.5 with longs if it unable to hold.
Downside
Here I am sounding like a broken recording machine… As I have been mentioning for various week’s on end, to get a seller case going the market must first breakdown below a key support level and manage to hold below to unfold anything. Of course this is step 1 of like 100. This week’s key support is at 5462.5.
Breaking below sets up 5449.25/5436.25/5423.75/5398-5390
The long trigger is 5519.5; buyers attempting another breakout higher I would watch the strength and conviction to follow through. Breaking above 5519.5 and failing to hold puts a fake breakdown set up under way. Follow through below 5462.5 is must on this set up.
All of this explained above is a counter trend trade. Of course somewhere down the future the market can reverse. But I don’t spend my time predicting or forecasting when and where it can happen. I am a intraday trader. My job is to react on the present moment that is unfolding and follow the trend. When it is time for the market to take a breather, we will all know by just breaking down below a key support level and establishing value below.
Let’s see what unfolds into this week. Using the 15min timeframe to allow us to stay objective into what direction the 1H and 4H can be heading into, to allow us to stay objective into what scenario is taking place.
For example, failing at 5497, we take one step back away from Scenario A, and nearing back into 5462.5-5473 1H lower range, we know this is a must hold area to keep the primary (A) trend trade in place. Breaking below here we began to deviate away and most likely developing (B) trade and considering it is a counter trend trade, can begin to unravel fast. Staying objective in this way allows us to adjust and adapt if needed to, but most importantly to manage risk effectively. The key point of this guideline here is to move us away from predicting and forecasting to staying objective into what is actually unfolding moment per moment. Huge difference.
As always, will be updating based off this plan via X!