

ES Plan Week #24
ES Plan Week #24
I update via X based on this plan as the market session unfolds in real time. Make sure to follow for the real time market updates! X (Twitter)- trader_izzy

Previous weekend newsletter setting up the past week.

Week Recap
Coming off a strong reversal on Friday, back into the key level of 5305.75, the question into this week was if buyers can get through to set another breakout attempt higher. It was yet another good week filled with opportunities both up and down.
Monday and Tuesday session played out very similar in terms of movement.
Let’s backtrack a bit further here. On 5/30 Thursday, as sellers were moving the market lower, buyers found intraday support at 5250.5-5262. That same session buyers were rejected from a pop higher and sellers managed to follow through below this 5250.5-5262 support area yet again continuing the downside move into 05/31 Friday. With another breakdown below 5250.5-5262 area, we then look for sellers to establish value below to find acceptance of the move. And well, we saw what happened on Friday with that aggressive reversal back through 5250.5-5262 and into the next breakdown area of 5296.75-5313.25 which set up the week for us.
Starting off Monday, retesting for the 1st time back into 5296.75-5313.25 breakdown area, it makes it risky to attempt longs immediately here. The best/strong case scenario for upside into these situations (which occur over and over and over) is to see buyers attempt a consolidation move to set up an immediate breakout attempt higher, and until this happens… this is a breakdown area, meaning sellers are in control of this zone and there is always a possibility open to sellers still being here smacking any rally that may come into this area. And this is what we saw during that session. Sellers stepped in putting a breakdown below 5296.75 which triggered a move back lower into 5250.5-5262 where sellers failed to follow through the previous Friday session 05/31. Testing back into 5250.5-5262, this zone was met with buyers moving the market right back into 5296.75-5313.25 to close out the session.
Tuesday session was no different. And when we zoom out in the daily timeframe, we see two hammer candles indicating that yes, buyers are buying the dip intraday day but overall muted session.
Knowing the market is stuck within a intraday buyer and seller zone, this is where zooming in into smaller timeframes is very key to get more detail on the price action. The two timeframes I used here are the 15min and 1H.
This is what I look at from these 4 attempts shown in the arrows.
Taking note of the first sell attempt below 5296.75, how aggressive are the following ones? Are they more impulsive? Size of the candles? The speed in terms how fast it takes to reach support? Are they bought quicker? Holding higher lows?
These are all clues, receipts of every buy and sell. Running back up into a previous breakdown area, we want to see if sellers are still strong within this area or demand from the reclaimed support (5250-5262) can over take the sellers here and break out higher.
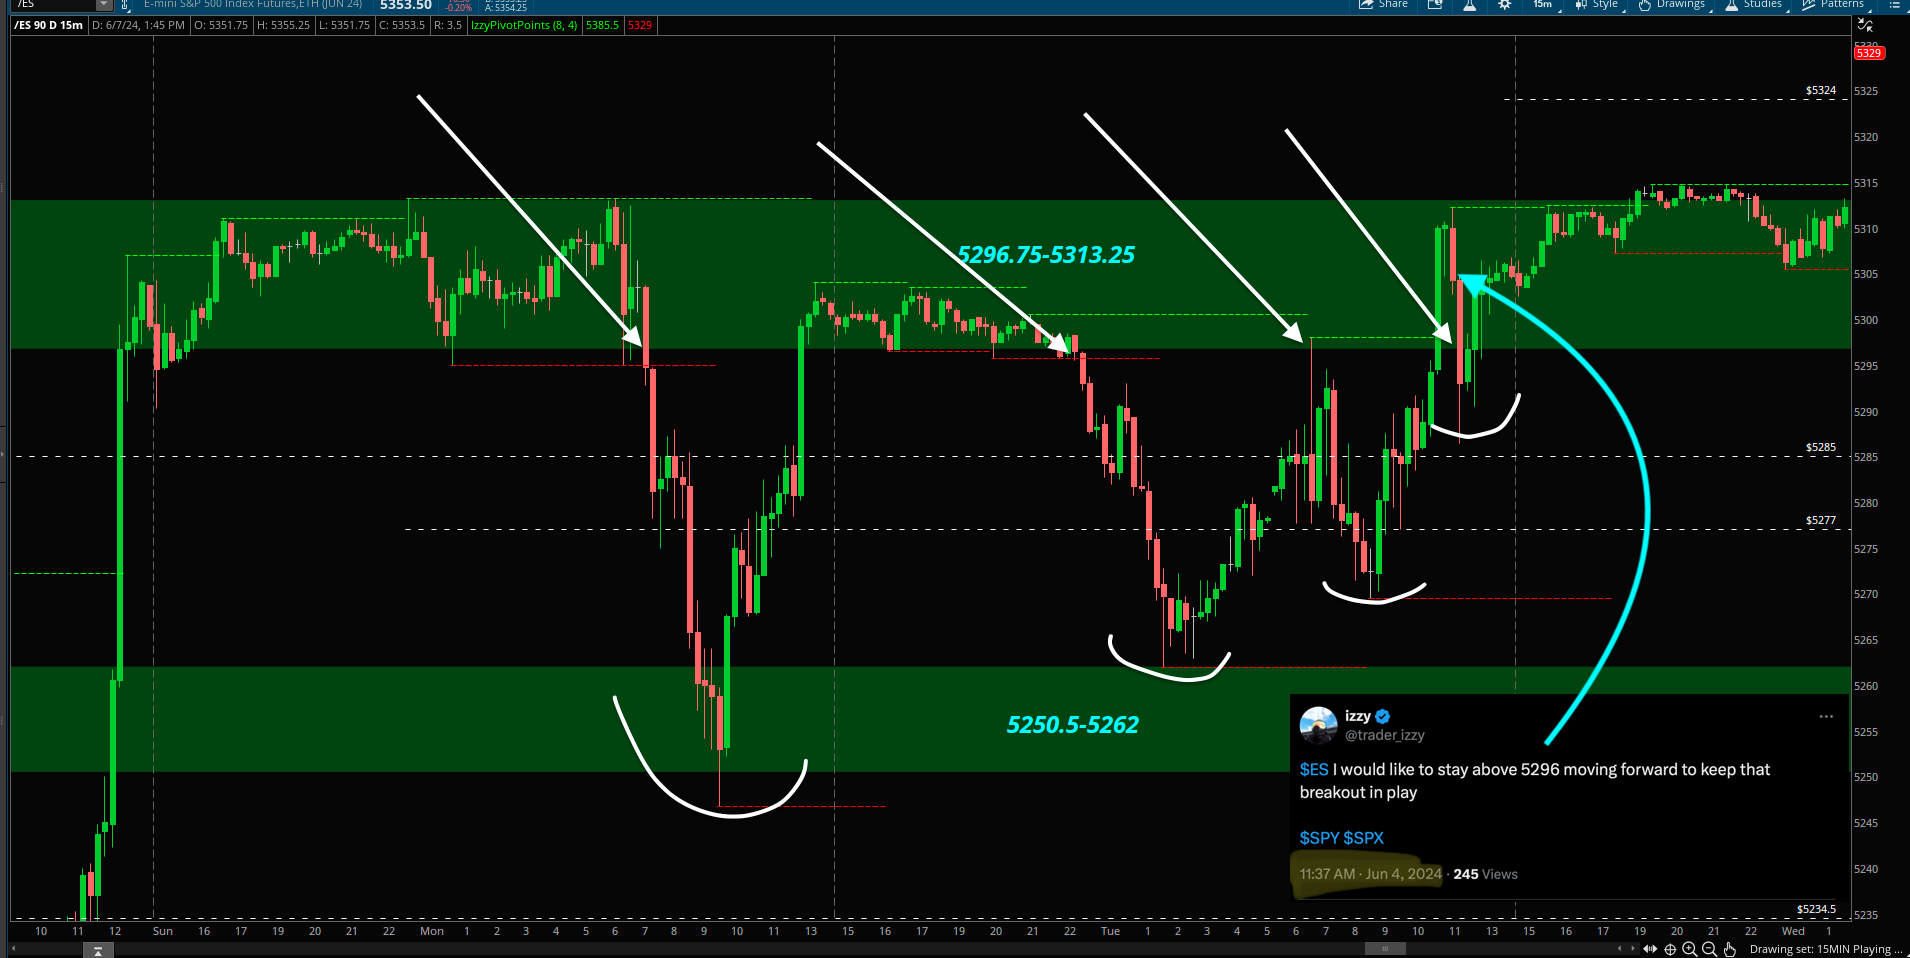
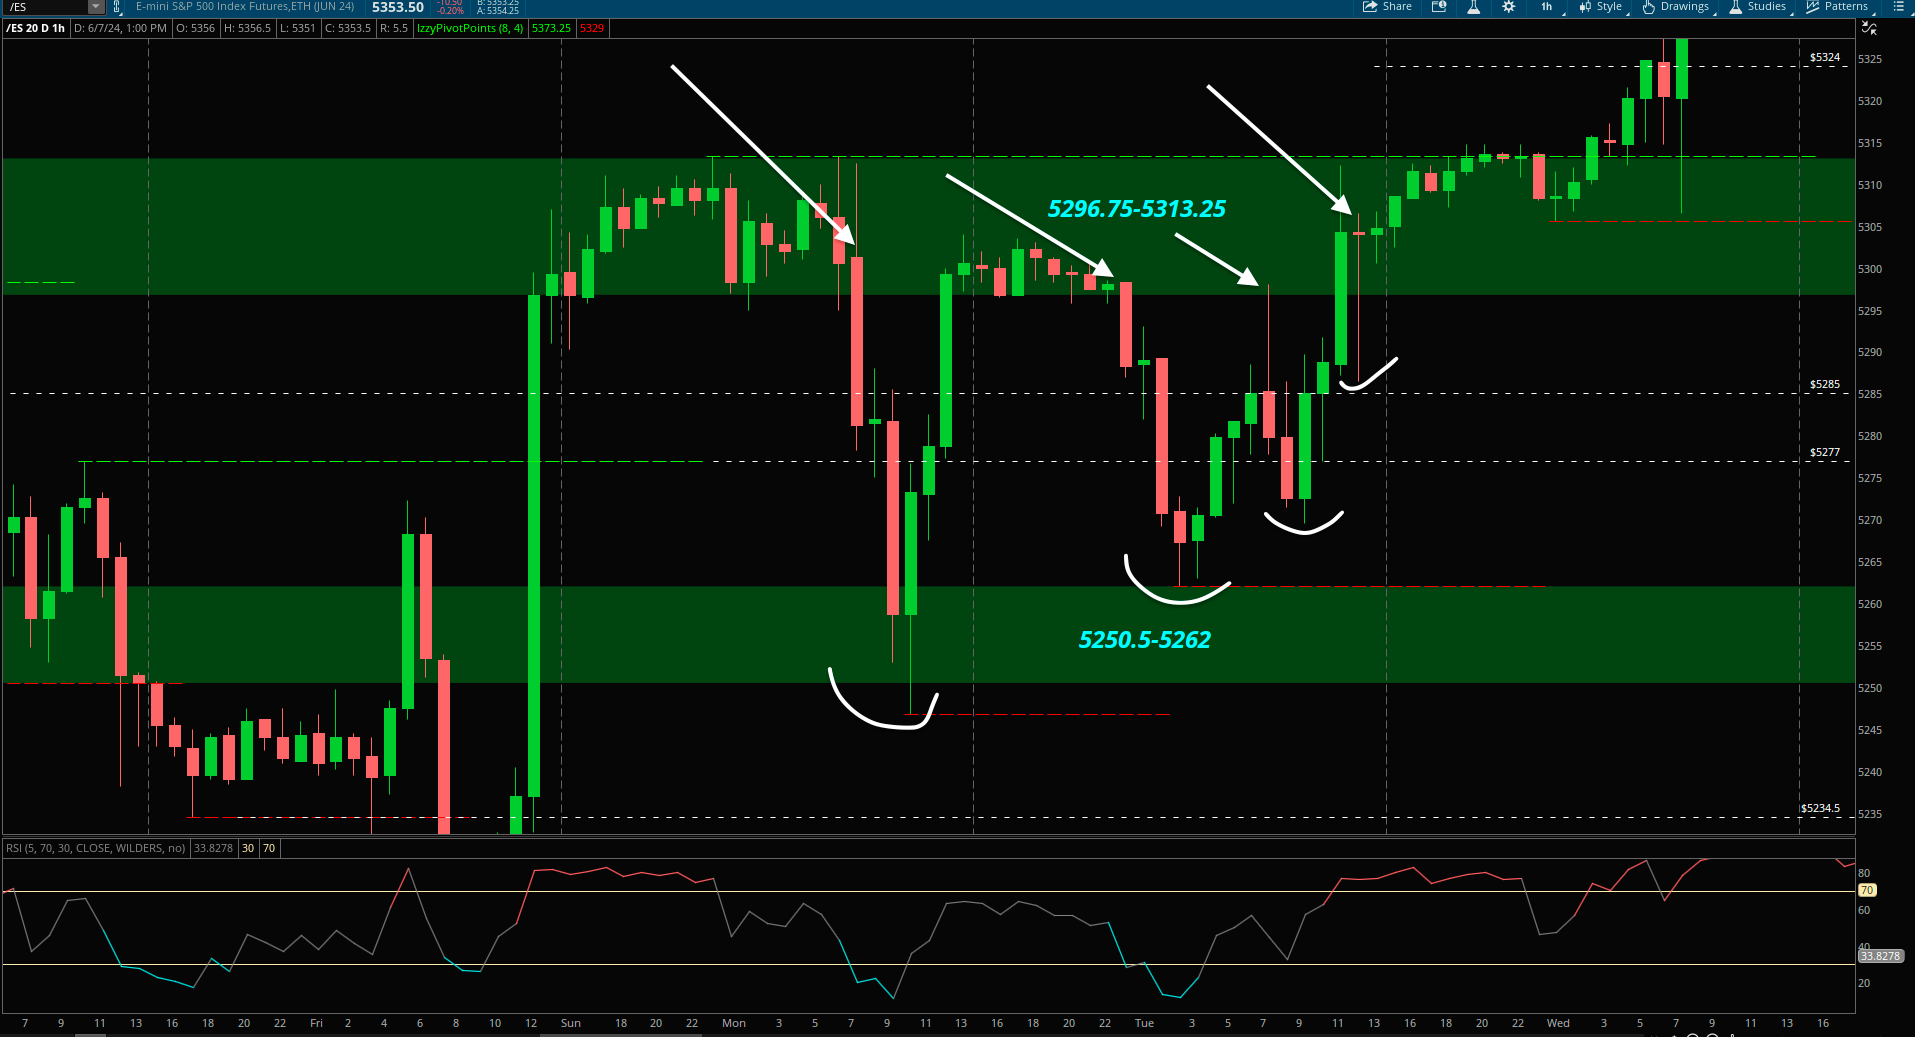
It is very clear to see here as buyers bought up every rejection, weakness from sellers was very telling as each attempt below 5296.75 was being absorbed and setting a reclaim of 5296.75-5313.25 to set up that breakout higher.
On Wednesday session it was very straightforward. Buyers were set up to attempt a breakout over 5313.25 to target the next area of liquidity being 5349-5368.25. And as mentioned late into Tuesday session via X, it was best to remain above 5296.75 to keep that alive.
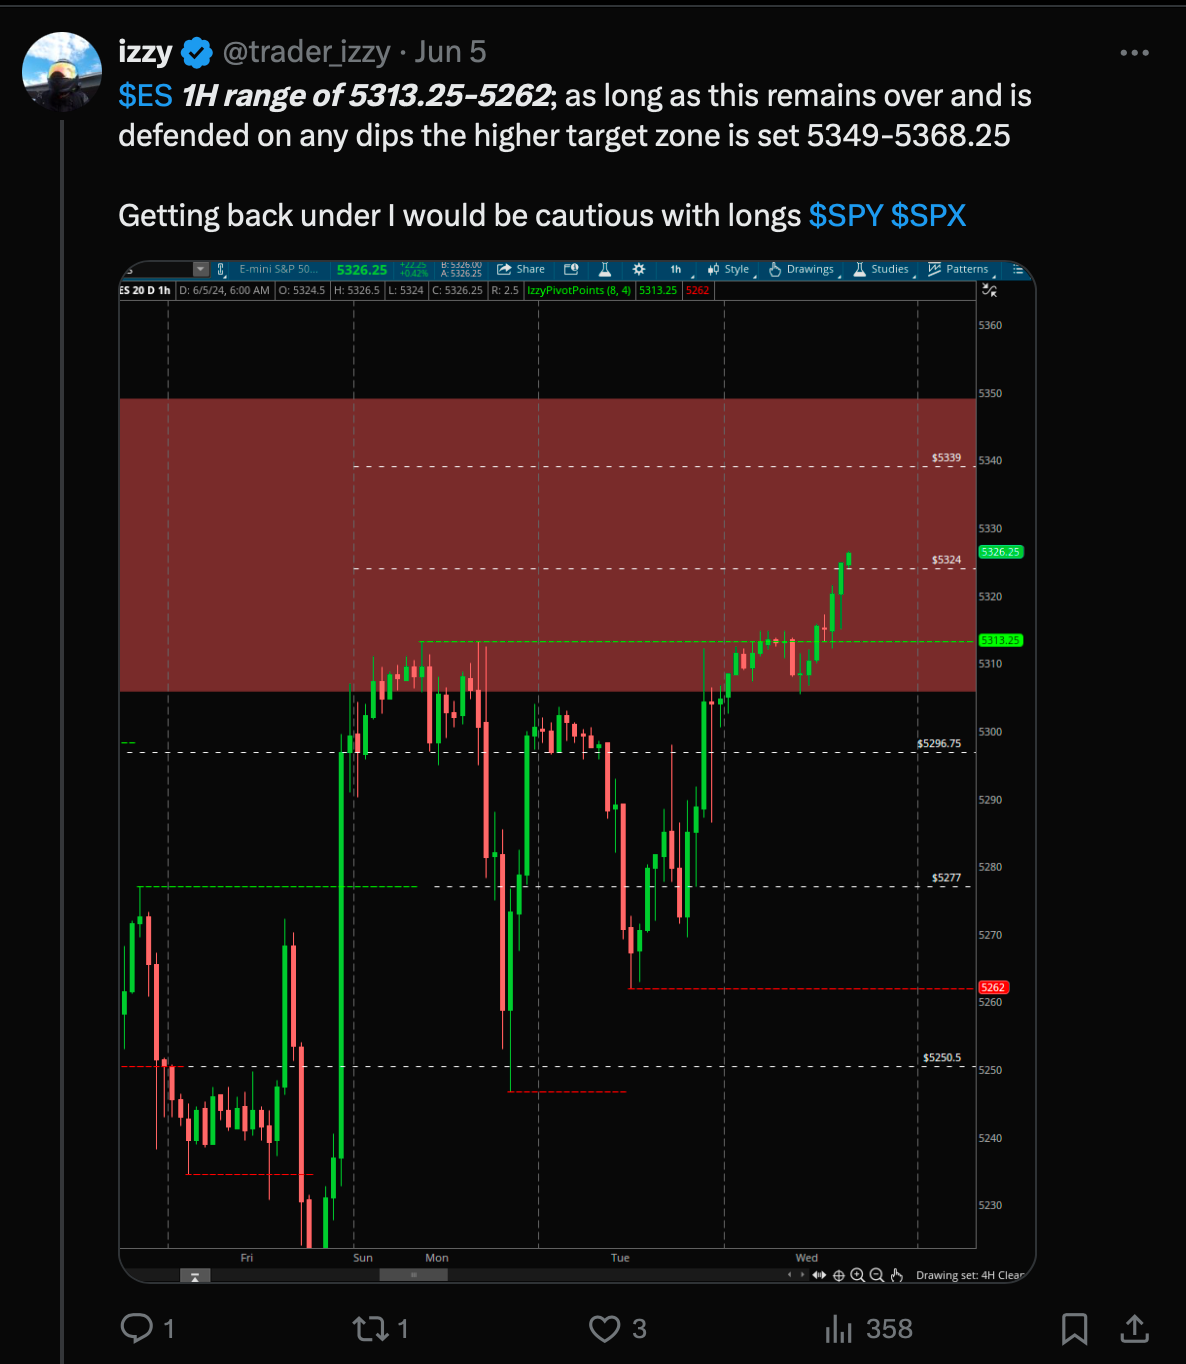
And as planned, above 5313.25 sent us into 5349-5368.25 on Wednesday.
Buyers attempted a breakout higher above 5368.25 on Friday which was quickly met with sellers both times intraday putting price lower right into 5349 support.
Starting off into this week, 5349-5368.25 will be the 1st zone of focus to kickstart direction. Let’s get into it.
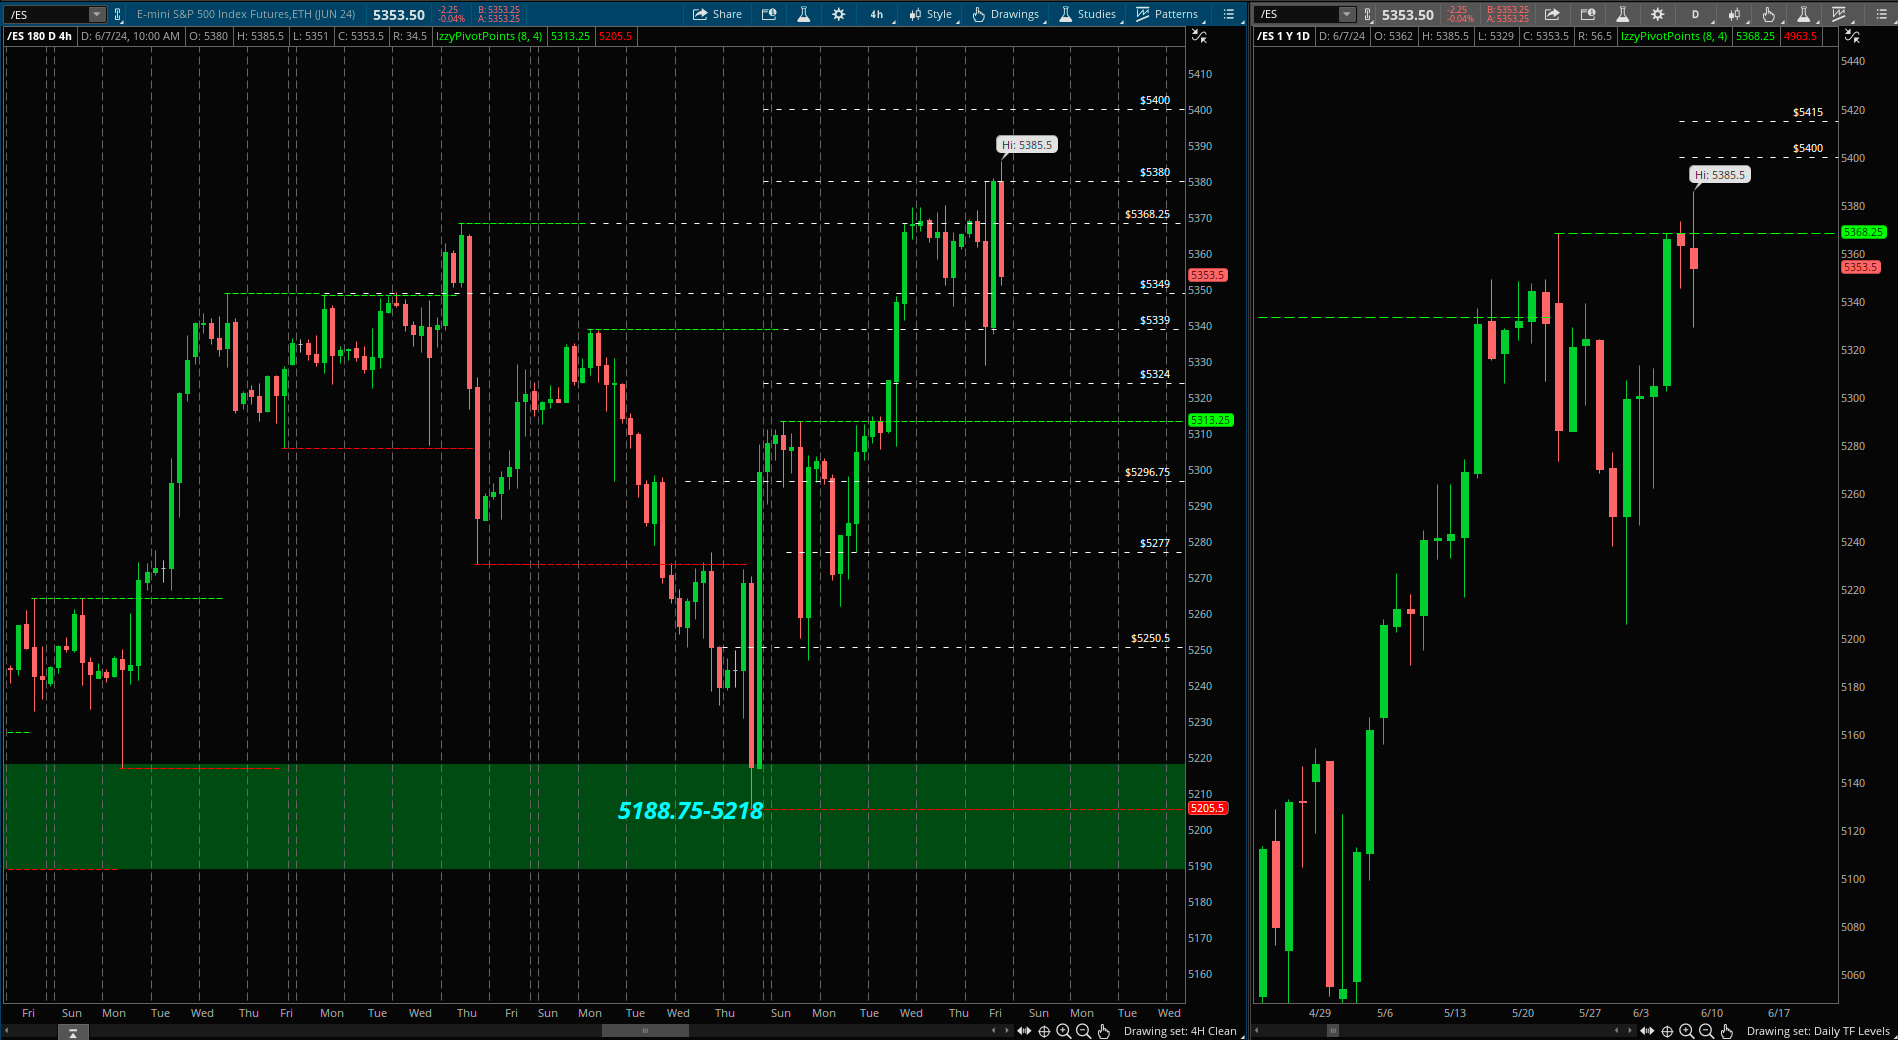
4H Timeframe Pivots 5205.5-5313.25
The breakout trigger in last week’s upside move came from 5313.25 and set up the test back into the bigger timeframe daily upper pivot of 5368.25
Upside Scenario- 5368.25 is the key level that buyers must hold over to keep a breakout higher in play to look for 5385/5400/5415
Downside Scenario- Failing below 5349 a retest into breakout trigger 5313.25
5313.25 is a key level buyers must defend if we come to retest into this week. Getting below 5305.5 starts to open doors into 5277/5250.5/5218-5188.75
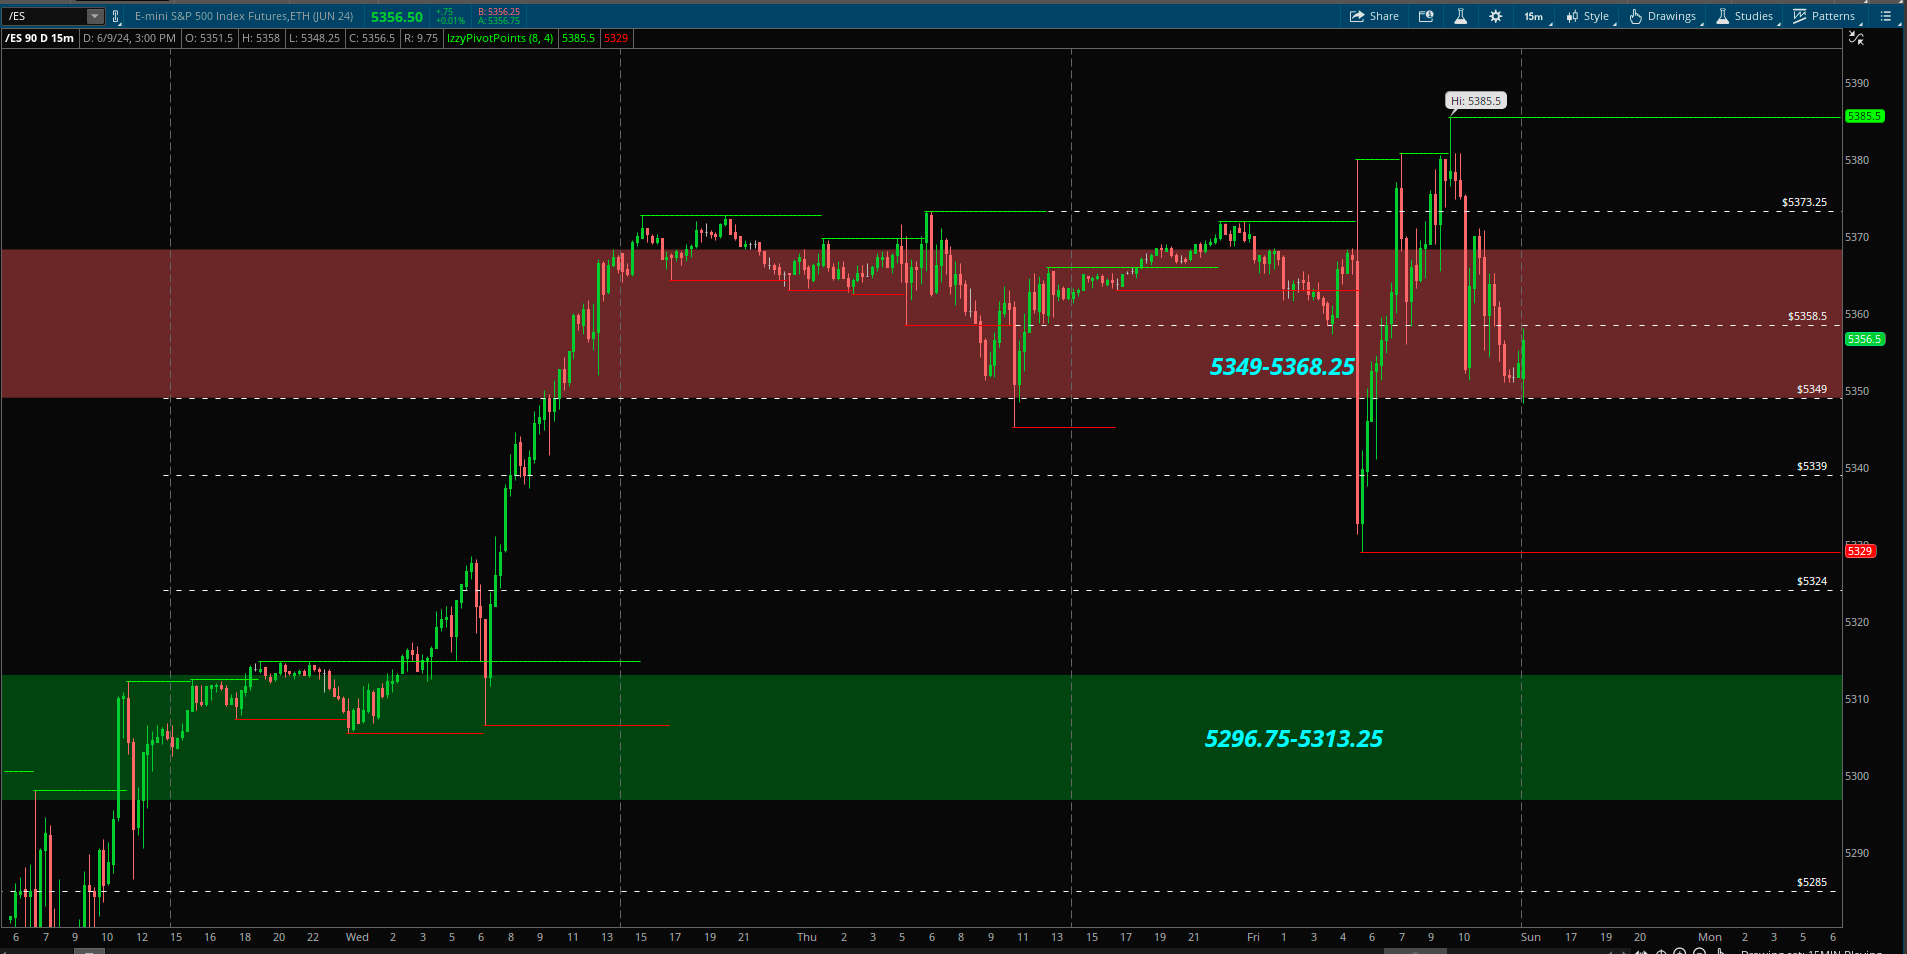
Playing Field- 15min Timeframe
Zone of focus 5349-5368.25
Buyer Zone 5313.25-5296.75
Upside
The immediate intraday support is set at 5349. It is best to see buyers defend this level to keep upside scenario in play.
Holding above 5349 puts long into play with intraday level to level targets set at 5358.5/5368.25.
5368.25-5373.5 is the trigger to target back up into 5385/5400.
Below 5349 I would be more cautious with longs and wait until 5313.25-5296 to attempt an entry there.
Downside
First downside scenario is set at 5349 targeting 5339/5329/5313.25-5296.75
Keep in mind that 5313.25-5296.75 remains a buyer zone since last week. Breaking under 5349, if sellers hold conviction and are strong a break below 5305.5-5296.75 can begin to open a bigger downside move into 5277/5250.5/5218-5188.75
We have a big week ahead of us with FOMC, making this week unpredictable. As always stick to monitoring these intraday buyer and seller zones and keeping as always trades level to level based on the price action. Buyers are in control as long as above 5313.25 and have been showing signs of consolidation within 5349-5368.25 setting up a break higher. Let’s see what this week brings forth. As always will be updating in pre market and with nightly newsletters.