ES Plan Week #22
ES Plan Week #22
I update via X based on this plan as the market session unfolds in real time. Make sure to follow for the real time market updates! X (Twitter)- trader_izzy

Newsletter from previous weekend if any review or full details needed to catch up.

Recap of Week #21
Heading into the week, the range of focus was set initially from 5315.5-5349 with the key support level of 5308.5. The bigger move was to come out of this range, buyers looking for continuation higher into this rally and with sellers to get anything going (1st step of many) would be breaking below the key support being 5308.5
I did mentioned that it could be possible to remain within this area and in doing so; all consolidation.
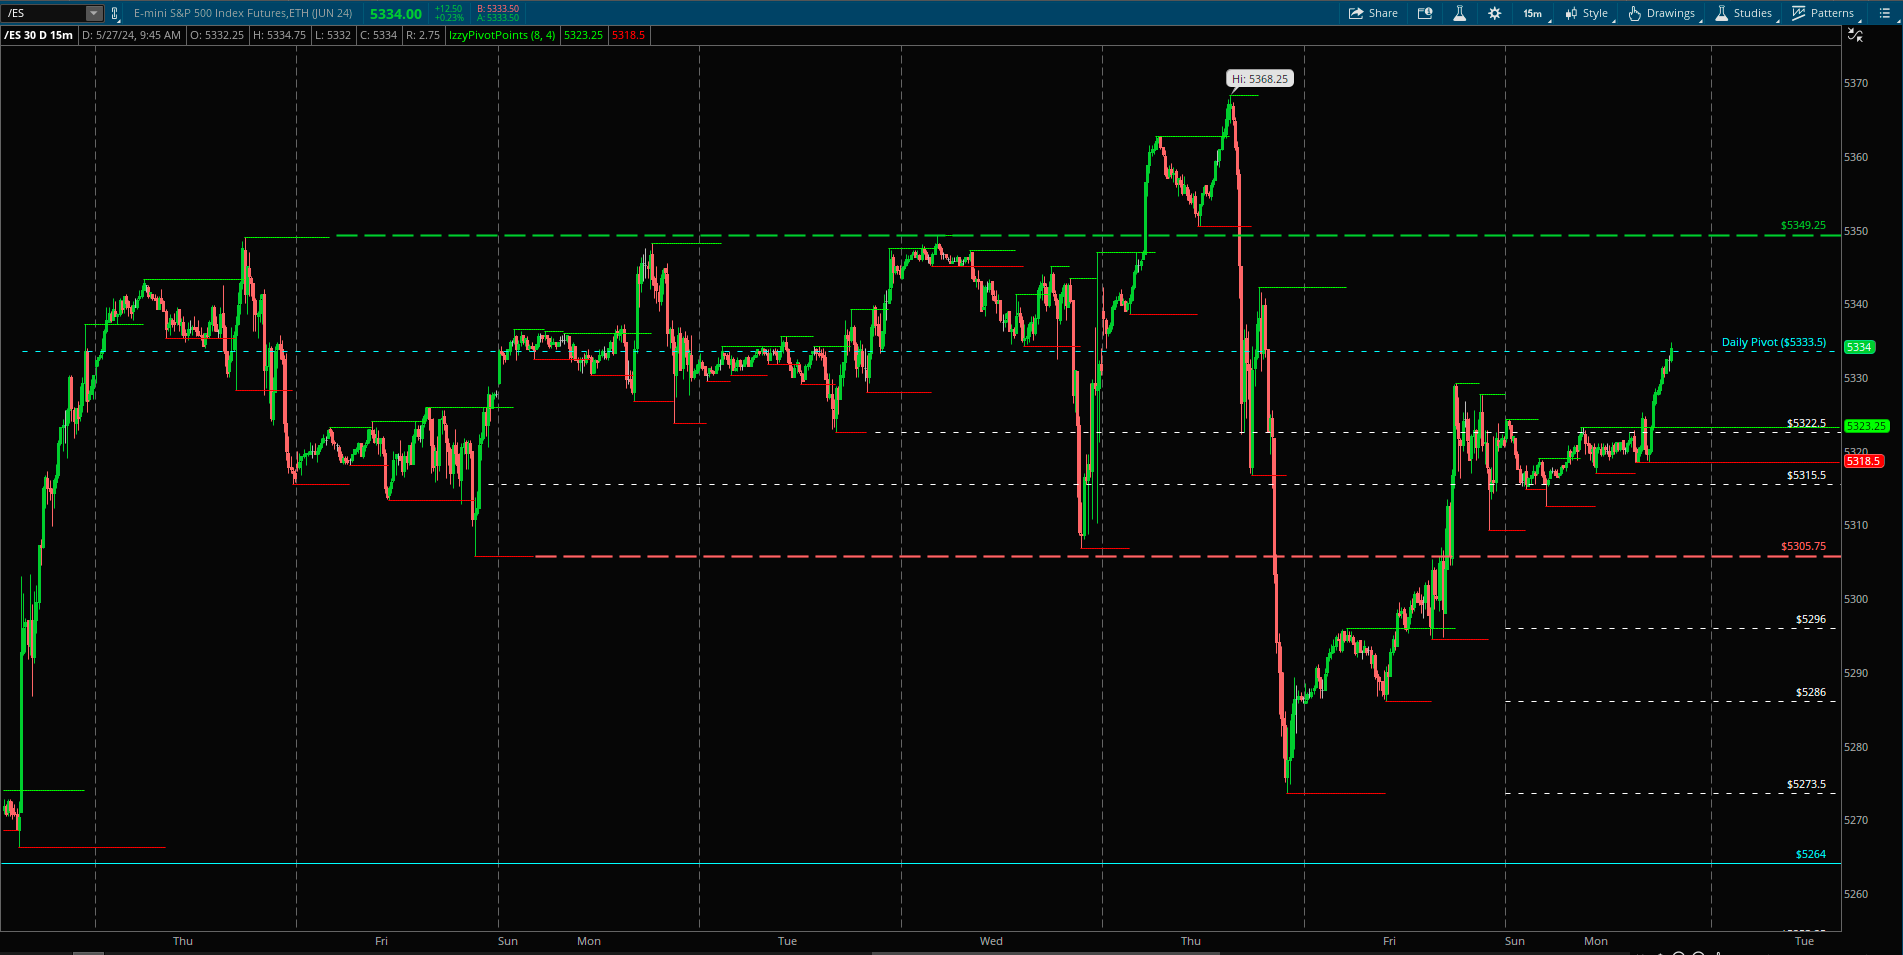
And that is all we got here this week. Volatility really picked up into Wednesday session when buyers failed to hold intraday above 5333.5 that put a breakdown intraday of 5333.5 level to test the lower part of the range which held and swung right back up 5333.5 late Wednesday heading into Thursday session.
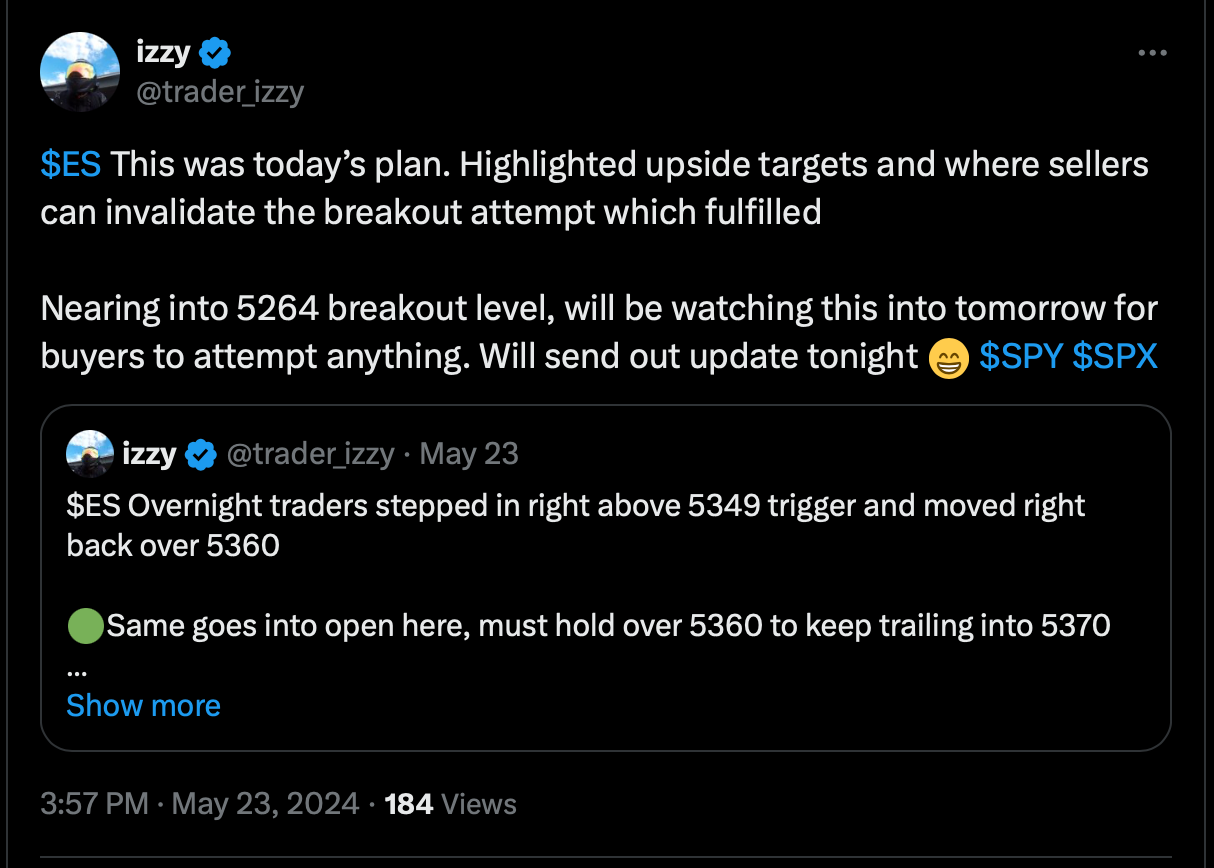
Thursday session buyers were set up for a breakout attempt above 5349 which triggered before cash open and nearly missed 5370 target by 2 points before reversing lower putting a failed breakout of 5349 underway. Momentum really picked up into this breakdown of 5349 straight into 5322.5 where buyers attempted to recover back over 5333.5 and then failed right into the lower range support at 5305.75. This didn’t slow down here. 5305.75 triggered another move down into the target of 5285. I mentioned this set up in ES Plan Week #21 downside scenarios to watch.
Thursday low was put in at 5273.5 near the 5264 level I mentioned to watch as we went into Friday session. 5264 is readers recall, was the long trigger on 05/14 which rallied the market another 100 points higher. This was no brainer that as we neared into this breakout trigger (5264), would be possible to be met with buyers.
Heading into Friday to close the week out, overnight traders rallied from Thursday’s low of 5273.5 back into the 5305.75 support level.
There was a key level to keep longs into play heading into cash open being 5296.
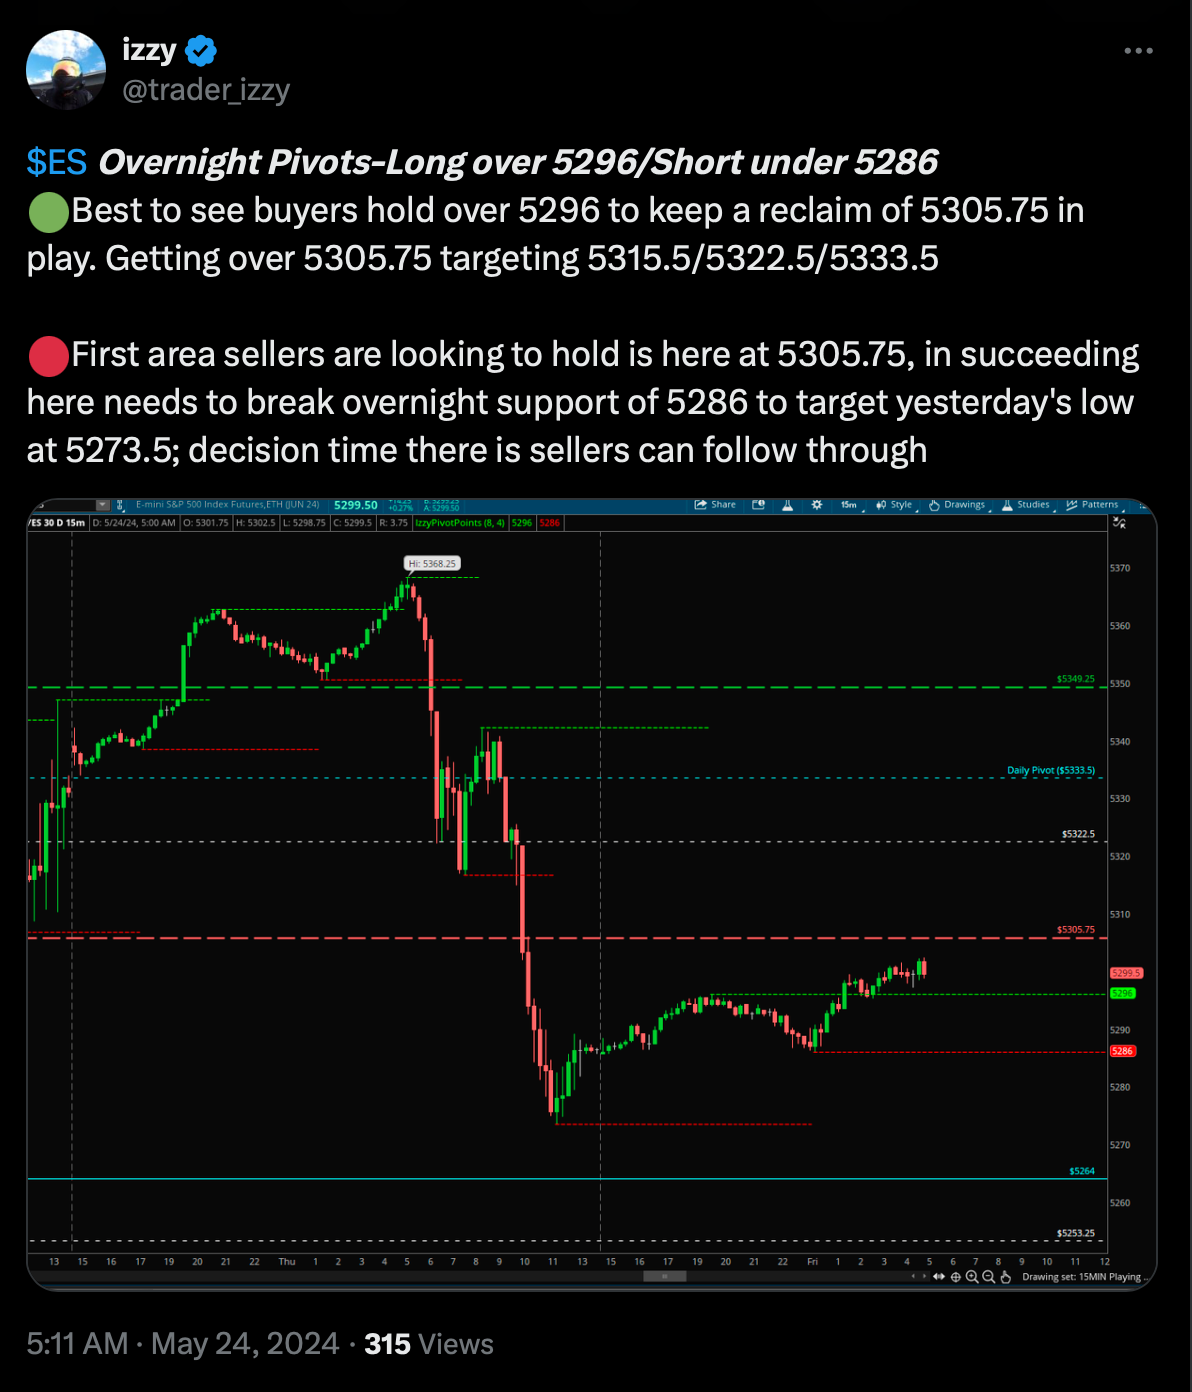
Since 5:30AM PST, the market ranged sideways intraday from 5296-5305.75 into 6:45AM PST where sellers attempted to test back under 5296 one more time undercutting with a low of 5294.5 which was immediately met with buyers finally able to follow through above 5305.75 tagging targets that were set at 5315.5/5322.5 and nearly getting into 5333.5 key level.
This past week here was a dream for a trader. Intraday volatility in both directions. Level to level trades as always. Carrying a bias as a trader is what can blur the road of consistency here and why the skill of being able to block outside noise (which can be news outlet, bears calling a top everyday, bulls mental state driven from euphoria, market predictions) is crucial.
The market has always been and will always continue to be an environment of 100% uncertainty. There are thousands of trading strategies out there, and neither are right or wrong. The methodology we choose to learn and apply in the markets is only there for us to apply some kind of market structure and handle risk management properly to take advantage of opportunities brought forth to us. This is important to understand here, that whatever methodology you choose to apply, the market is unaware of YOUR rules of market structure. There are no rules the market has to abide by. It can do whatever it wants at any time and without reason. Think about this as if you were a fisherman in your boat navigating through the ocean. The fisherman has to be experienced in navigating through any ocean currents or storms that may come. The fisherman also knows the risk of being in an environment like the ocean. At any moment, without reasoning, a strong wave(s) or storm can arise and if the fisherman is not prepared, can be wiped out. And the ocean, being so big in its nature, will never even know it has wiped out another boat and will continue to be in its nature as if nothing happened.
Friends, it’s the same here in the markets. Looking for or attempting to create certainty through any methodology is all but an illusion and an escape from the fear of uncertainty. Uncertainty to majority of people, immediately brings the thought that there may be a possibility of a negative outcome. The brain does not like this one bit, even if it is .0001% chance of loss. Now the mental framework brought into trading is driven from this fear. Trading not to lose quickly blurs proper risk management and effective trading.
A great trader embraces the uncertainty and is open to any possibilities that are brought forth rather than being set on looking for certain outcomes that may not even come.
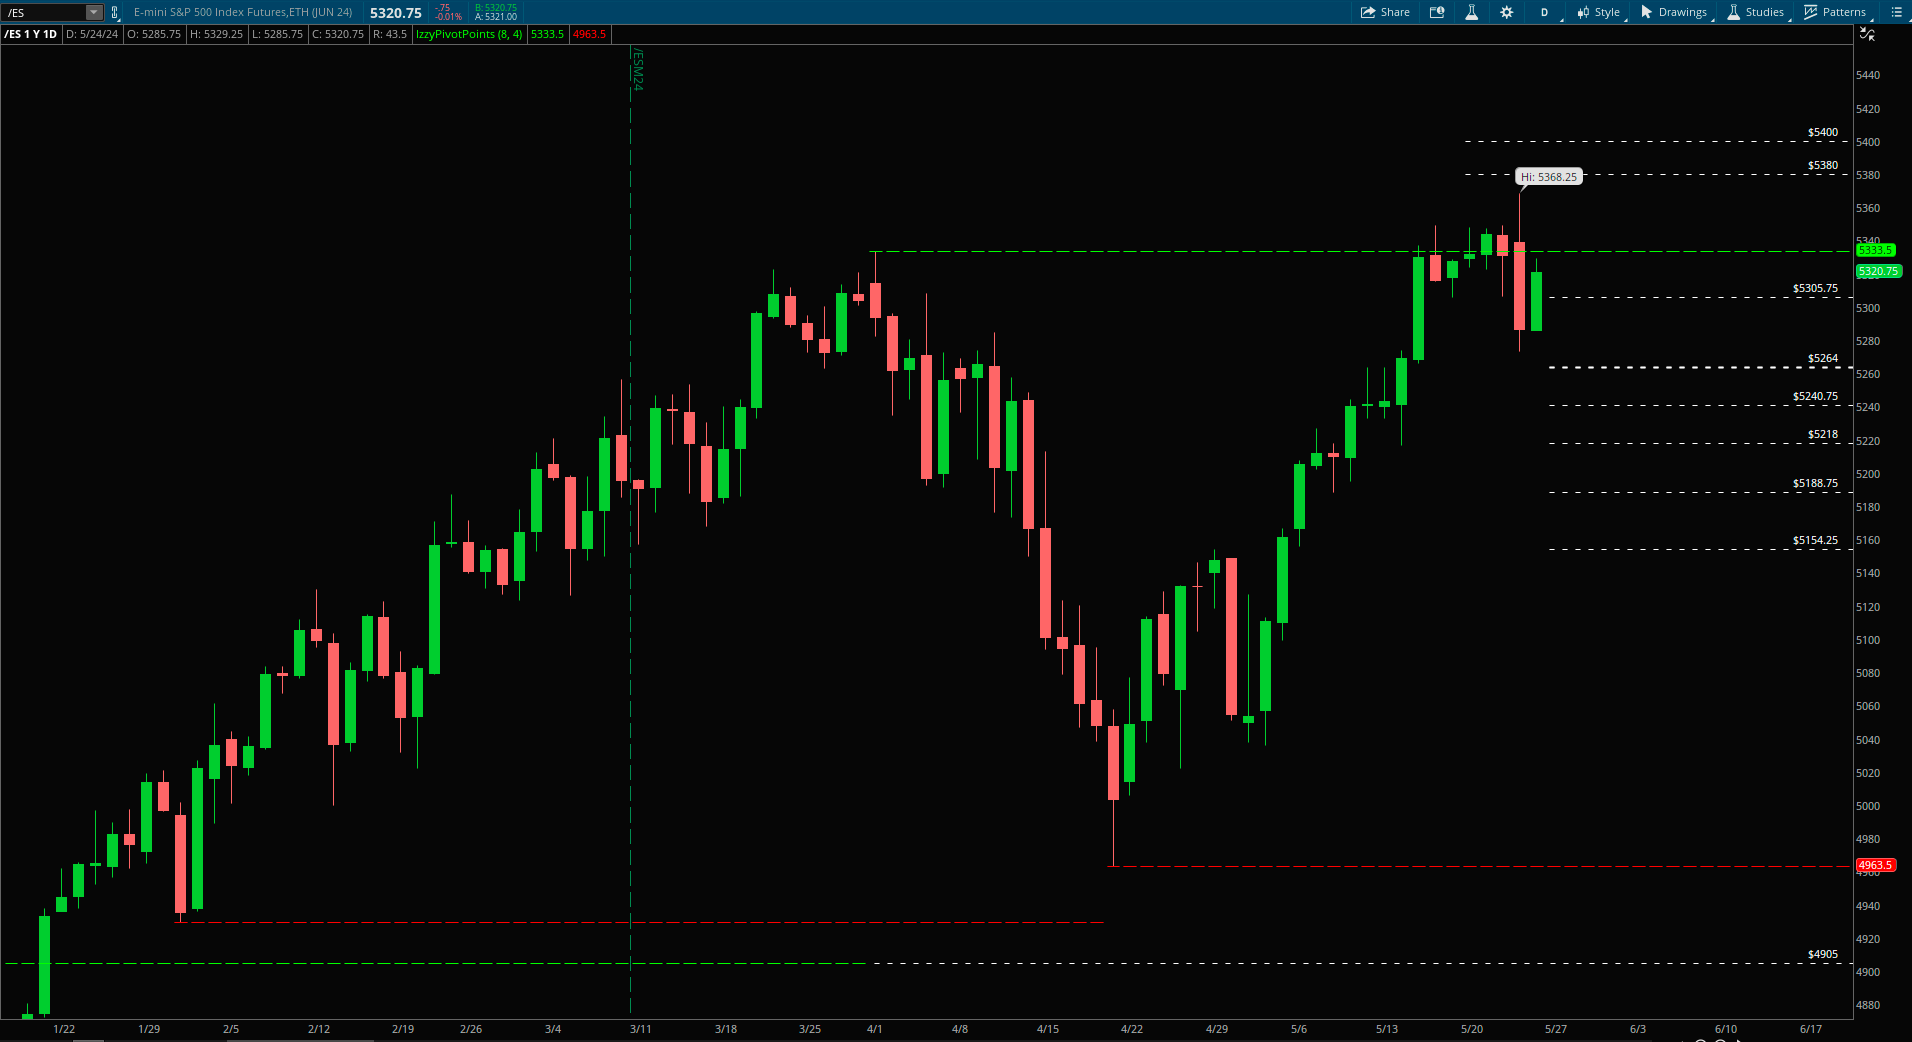
Daily Timeframe Pivot Range 5963.5-5333.5
This is the wider range the market continues to be in and once again 5333.5 will be a key level entering this short week.
Getting above 5333.5 opens the door to revisiting 5349/5368.25. A strong response into this week would be buyers establishing value above 5333.5 which can open the doors to break out higher targeting 5380/5400.
5305.75 is the main support area and weaker now on any revisit. This support fails the market can begin to pullback with bigger targets set at 5273.5/5264/5240.75/5218
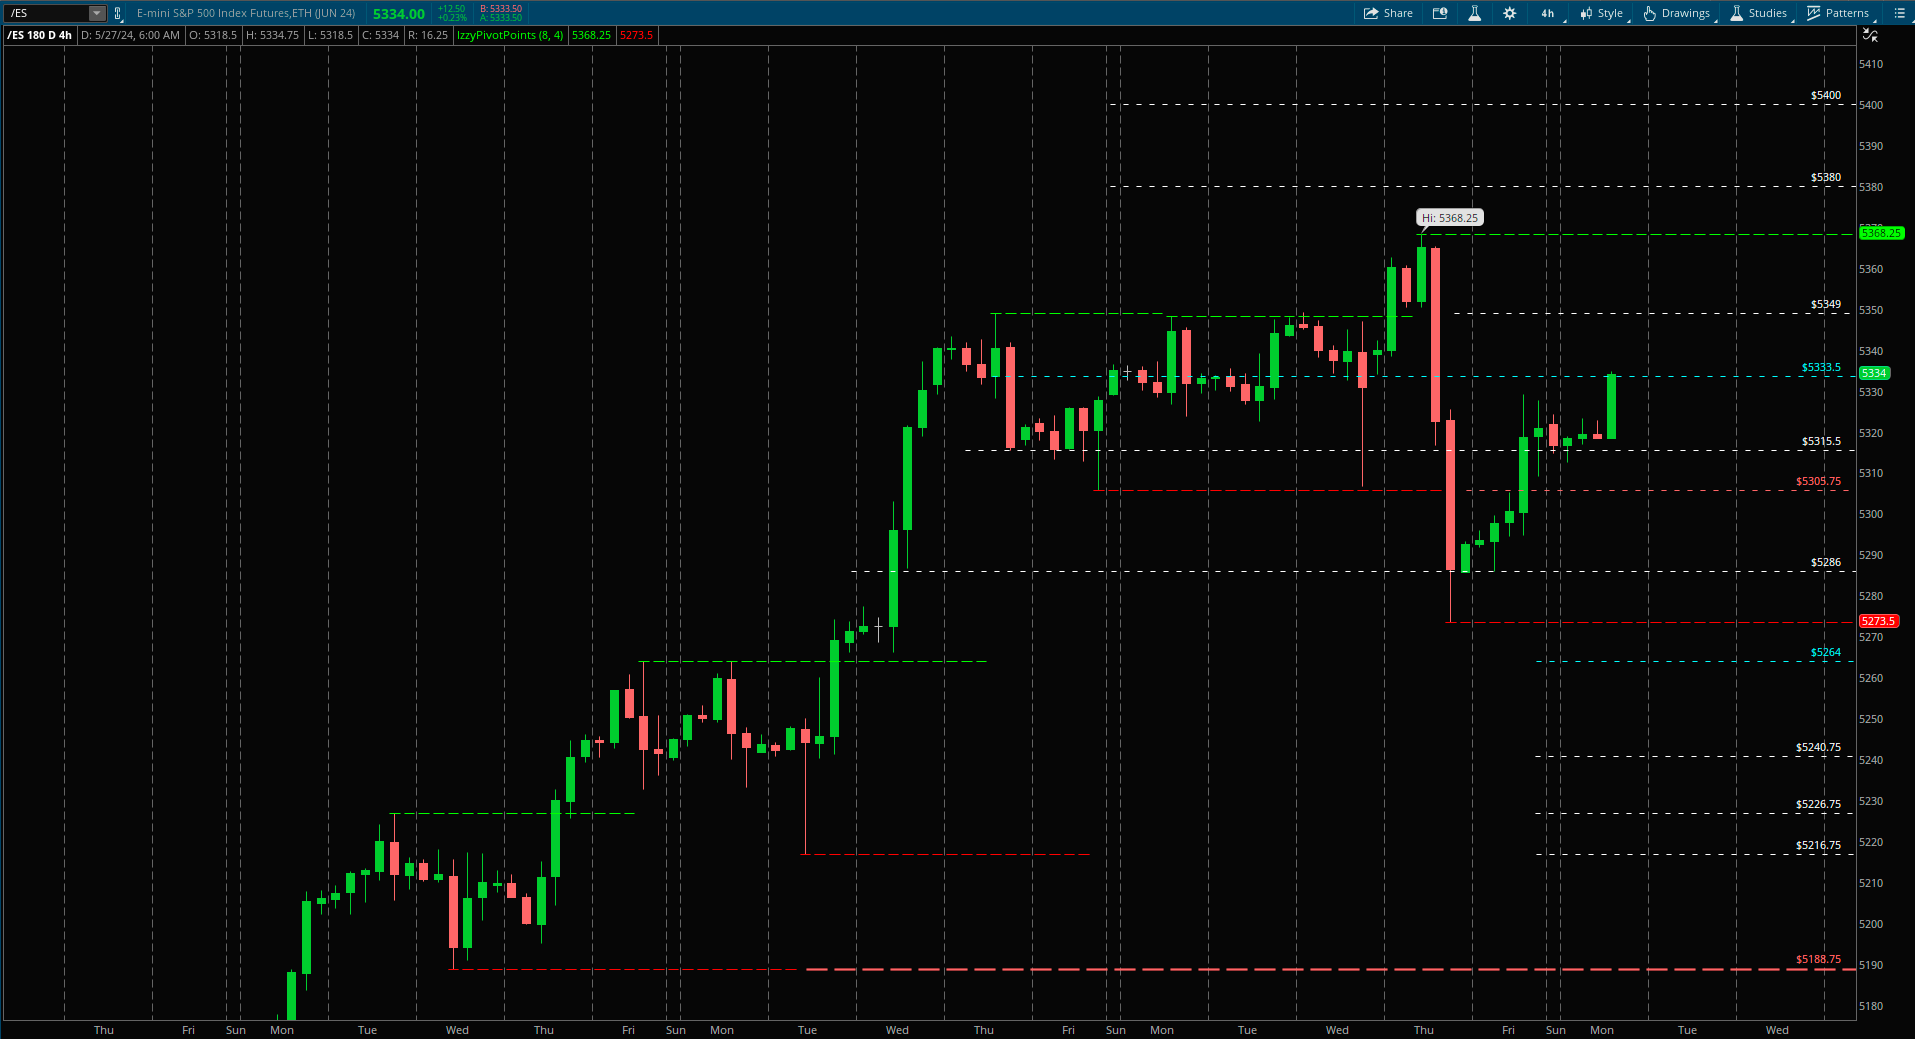
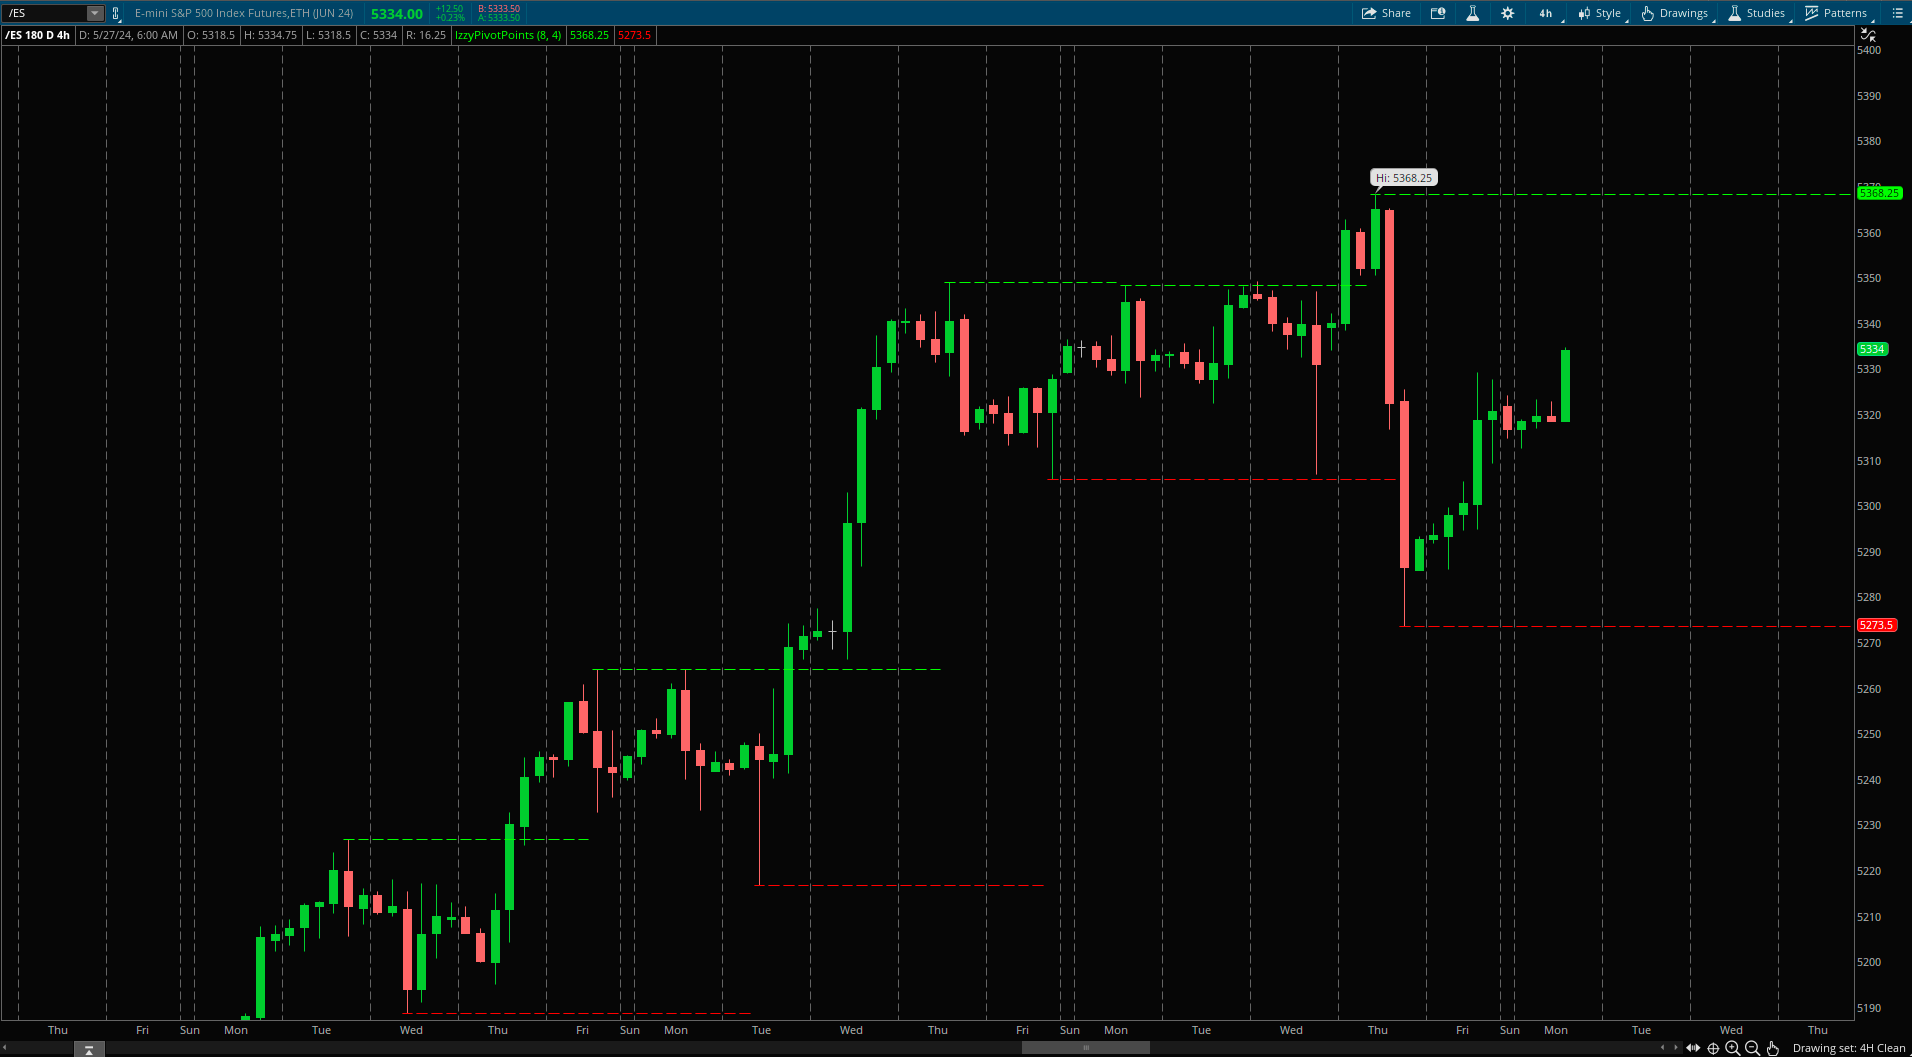
4H Range Pivots 5273.5-5368.25
This is the wider range I will continue to watch this week. Sellers attempted a breakdown of 5305.75 last Thursday which was met with buys and moved back over 5305.75 Friday putting 5333.5 back into play.
Market remains within a range and since previous week’s undercut of 5305.75, the range was expanded a bit here based on this 4H Timeframe. As always, it is possible the market can continue trading within this range and I would treat it so as always. When the market is ready for direction, the bigger move comes out of this range here. Pivots below to watch for the bigger move.
(Upside Scenario) 5368.25- Trigger to break higher targeting 5380/5400.
(Downside Scenario) 5273.5- Revisiting previous week low begins at the failure of 5305.75. Breaking below 5273.5 the market can begin to pullback giving sellers momentum.
Let’s go over some support areas under 5305.75. If this level were to fail, as I mentioned, I would be more patient with longs and watching these areas for buyer activity.
5264 remains on watch as it was the 05/14 breakout trigger into a 100 point rally
5240.75 key support (major) failed breakdown buyers put in 05/14 that led into 5264 breakout
5188.75-5218 zone (major), buyers reclaimed above this zone and consolidated for 4 sessions before breaking higher and leading another continuation higher into this rally.
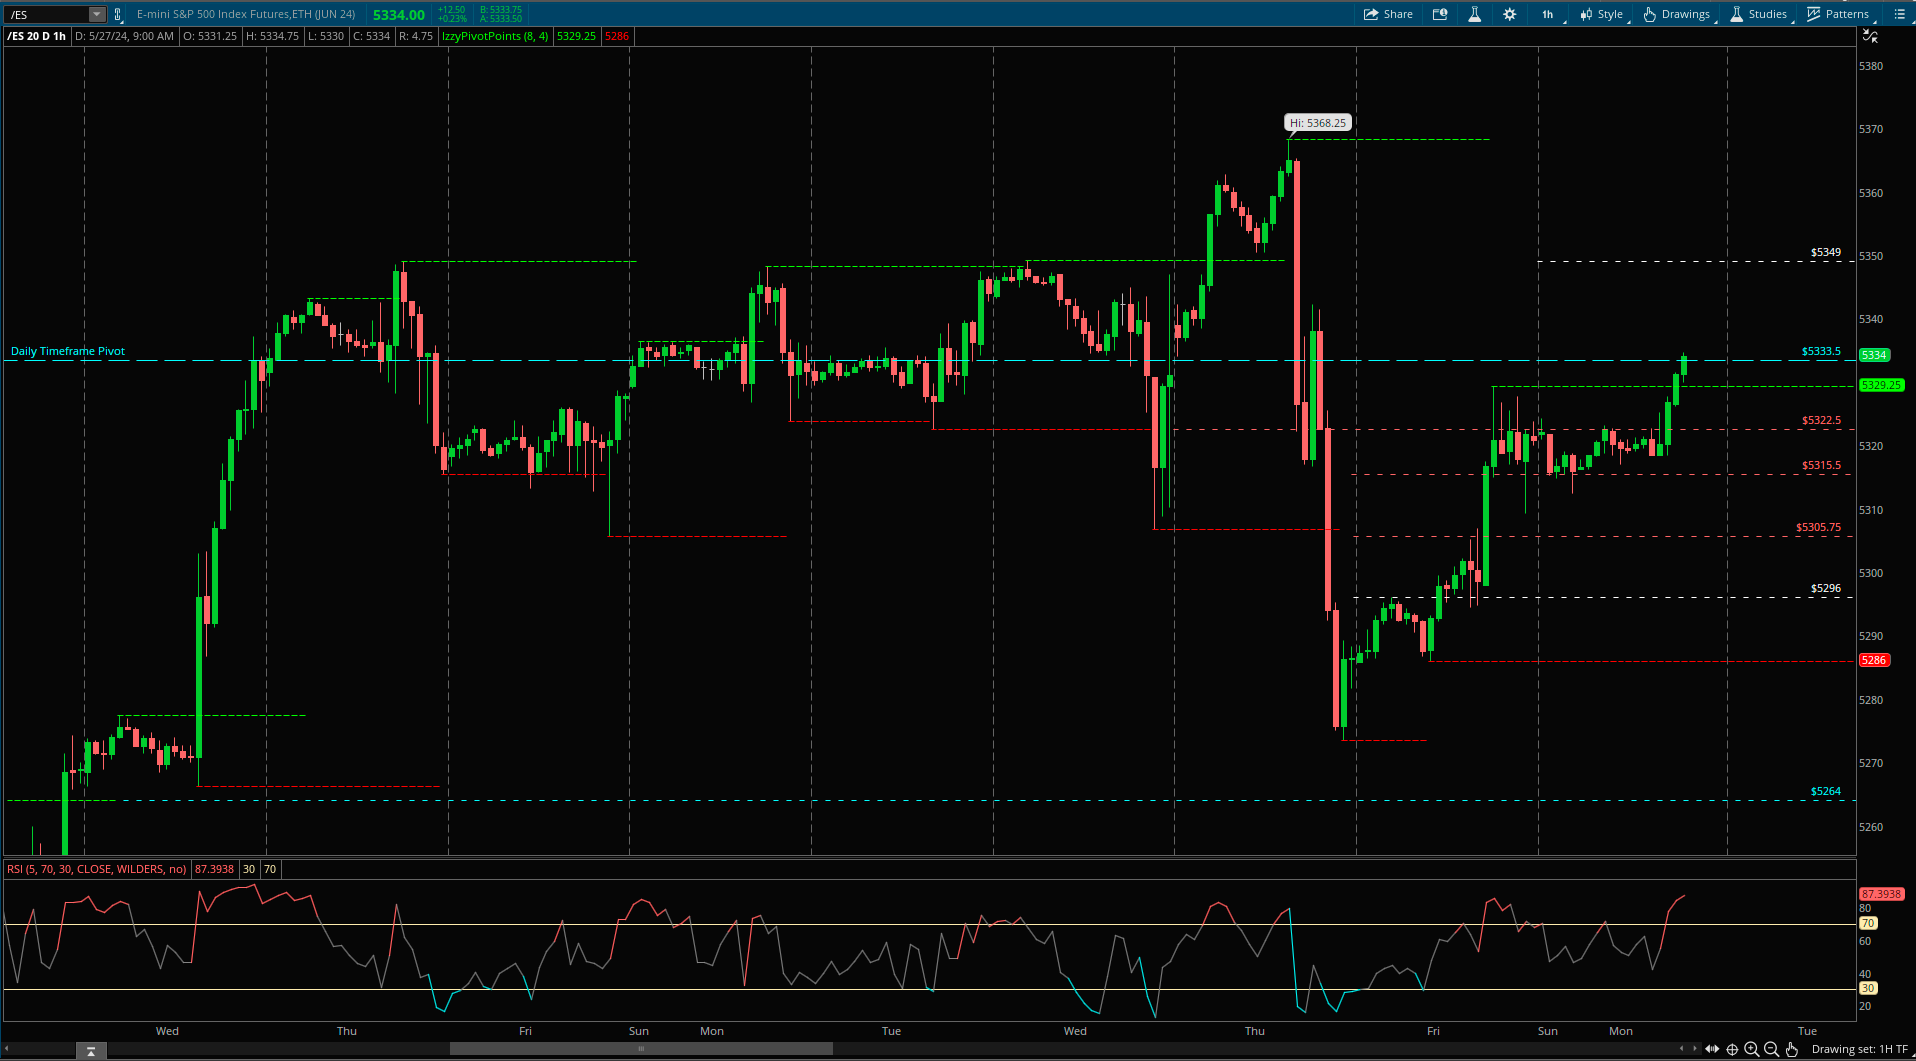
1H Timeframe Range Pivots 5286-5329.25
Closed out a short holiday session (Monday) with the market holding 5315.5 level and moving through 5329.25 (Friday’s high) and 5333.5 Daily pivot.
This makes 5329.25-5333.5 a key support zone heading into Tuesday session to keep immediate upside into play. Holding above here is the 1st clue that keeps 5349/5368.25 on watch starting off the week. Testing into 5349 and seeing sells come in, it would be best to see this support zone 5329.5-5333.5 hold to keep a break of 5349 in play to look for 5368.25
5333.5 has been a battle here for both buyers and sellers past few sessions, with either side unable to establish value above/below for to long. Breaking under 5333.5 there is one last intraday support I am looking at being 5322.5 that gives one last shot for buyers to move back over 5329.25-5333.5, this would have to be done immediately intraday otherwise could present weakness/lack of buyers. Breaking under 5322.5 is what gets the snowball moving here into a seller view. Under 5322.5 looking to target 5313.25/5305.75/5296/5286/5273
15Min Playing Field- Putting Everything Together
Monday 05/27 intraday range 5323.25-5318.5
Key Level 5333.5
Upside
Pulling from the 1H pivots, heading into Tuesday to keep trailing higher, as mentioned 5329.5-5333.5 is the immediate area I am watching for momentum to target 5349.
In holiday Monday session, the market was within a intraday range of 5323.25-5318.5. Longs were triggered above 5323.25 putting a move into 5329.5-5333.5. As I said above in the 1H section, if the market puts in a intraday dip starting off into Tuesday, I will be watching this 5323.25 trigger to hold on a retest but would like to see a move back over 5333.5 immediately showing strength to consider quick longs.
A immediate strong response would be moving straight up into 5349, seeing sells hit here I would like to see buyers hold 5333.5-5336.5 area to keep a move through 5349 in play.
I would avoid longs on failure of 5315.5
Downside
Buyers maintain the market within this sideways movement with overall trend in their favor. We saw the breakout failure on Thursday above 5349 that put in a good move into downside. This showed us here that buyers are still buying the dip. The demand here has been collected well enough at 5305.75 support area past few sessions. This is setting up buyers to test into the upper range. On any breakout attempt higher, I would continue to watch the strength of the follow through and ability to maintain the higher prices just as mentioned last week above 5349.
On any failure to follow through higher into this week, 5333.5-5322.5 is the zone I will be monitoring for a turn around. This zone 5333.5-5322.5 is the upper area of the 1H range, unable to hold here just gets us back within the range putting 5305.75/5296/5286 in play on downside. Below 5315.5 is where I would consider to short. But as I have been mentioning here and advising the risk here. Buyers are in control and remain so until failure of a key support level. When does this happen? No one knows, remember what we talked about early into this newsletter about the uncertainty into the environment which explains the high failure rate of this domain. Patience, disciplined, present in the moment calm state of mind is the holy grail in trading. It allows us to react to what is brought forth rather then sitting in position based on predictions hoping it goes our (your) way. One is sustainable long term, the other isn’t.