

ES Plan Week #20
ES Plan Week #20
I update via X based on this plan as the market session unfolds in real time. Make sure to follow for the real time market updates! X (Twitter)- trader_izzy

Here is last weekend’s newsletter if any review is needed.

ES Plan Week #19 Recap
This past week was very straight forward. If readers recall, buyers were able to set a reclaim of 5104.5-5128 buy zone on 05/03/24 after all the FOMC volatility which set up a breakout above 5154.25 (4H Range) to end week of 04/28-05/03.
Kicking off into Week #19, Monday 05/06, the main objective to look for was to look for continuation above 5154.25 to keep a reclaim of the next zone above being 5185.75-5213.25 in play.
Without a doubt, buyers put in the move from 5154.25 into the zone of 5185.75-5213.25 to start off Monday.
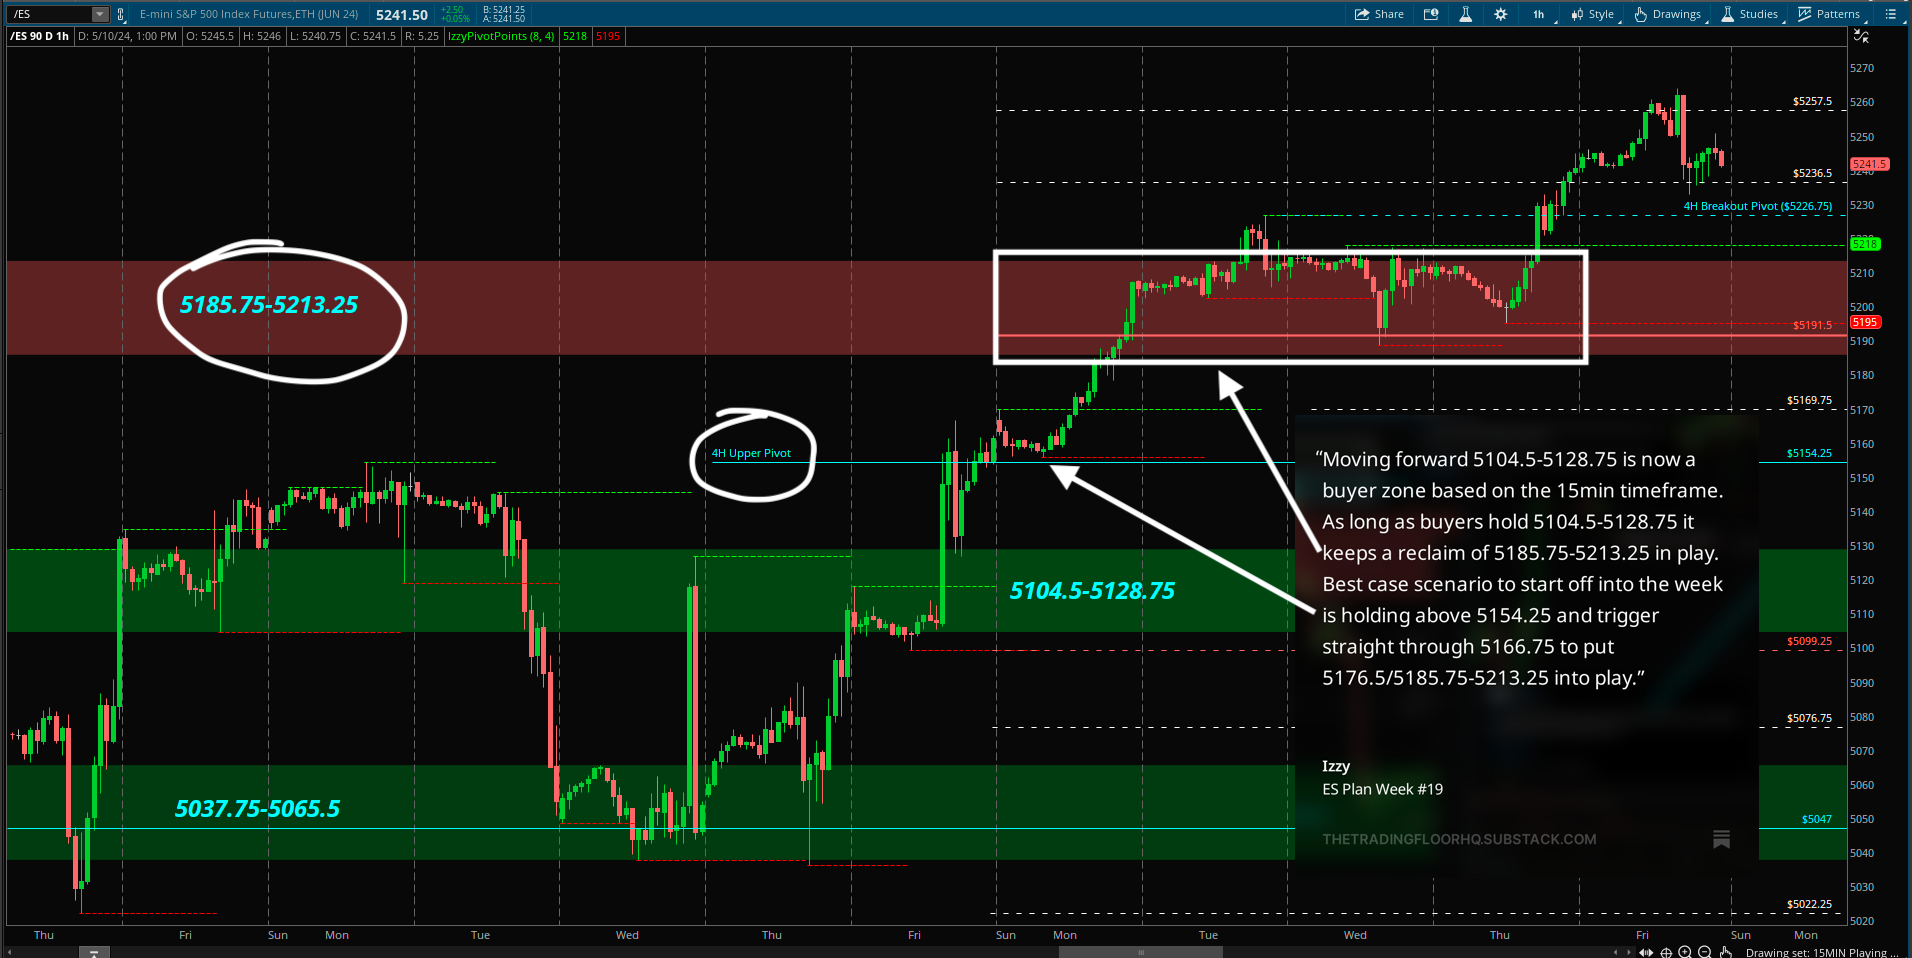
In ES Plan Week #19, I spoke extensively about 5185.75-5213.25 and its importance. This was the prior breakdown area that led the move into the April lows. Being a bigger timeframe breakdown area, these were my two main questions if we can enter this zone. Were sellers interested here still? And if so, how impulsive and strong are the sells that come from this zone?
These two questions alone is what made this past week very straightforward. Buyers consolidated within this range and held above 5185.75 support with no real sign of selling pressure.
Into Tuesday session, price action was very very slow. And seeing this kind of price action after 3 trending sessions and 150+ points higher, it’s no surprise. Following Tuesday’s failed attempt to continue higher above 5213.25, sellers made the first attempt to test near 5185.75 support into Wednesday session which was bought up very convincingly right back into 5213.25 early into the session which then just remained trading within a 10 point range to lead up into Thursday.
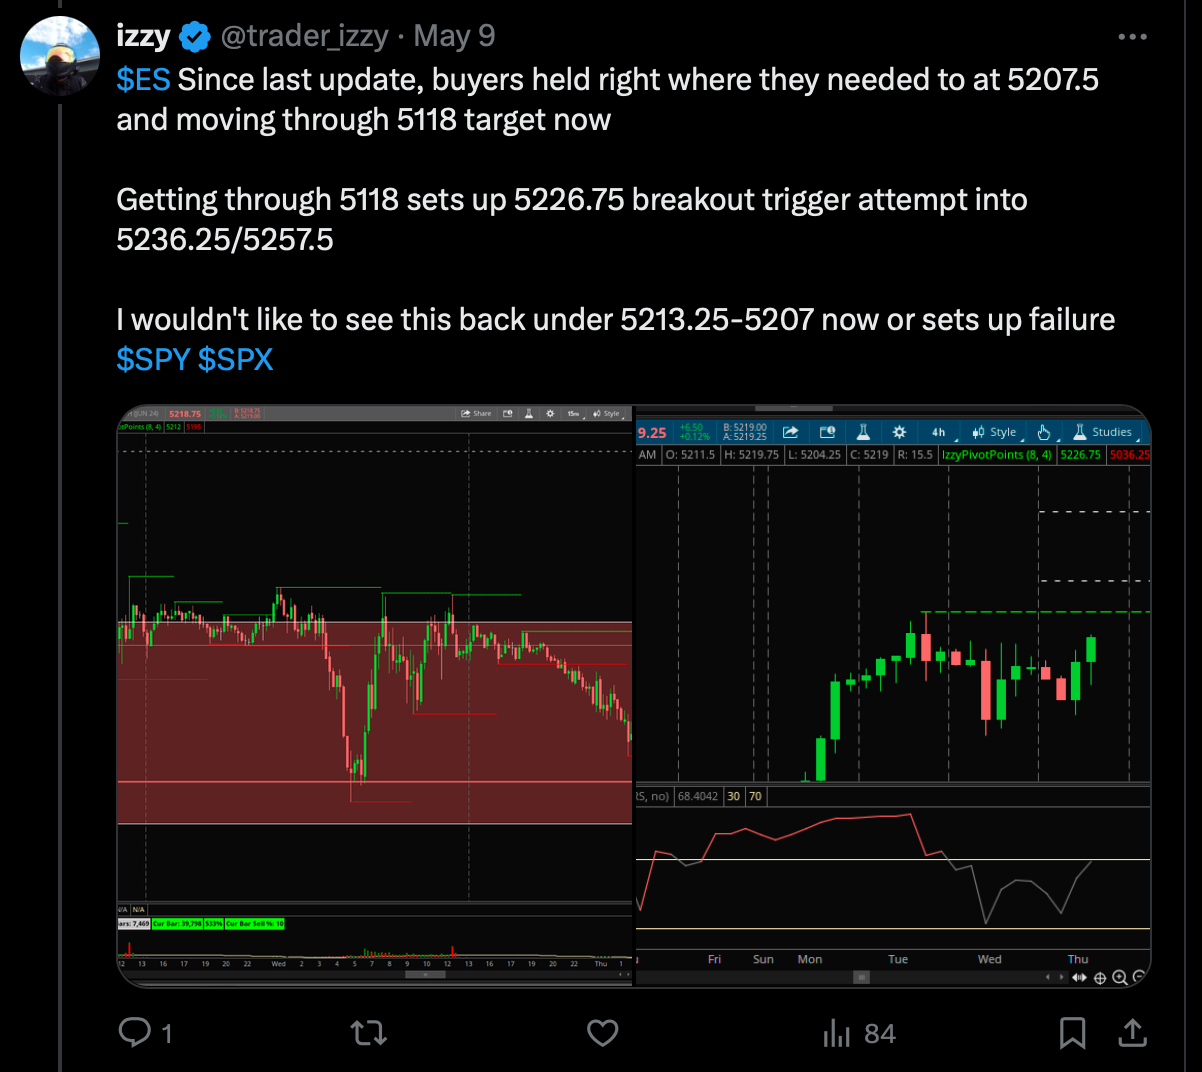
With buyers in position from Wednesday’s bought up dip into 5185.75 support, this was set up for a breakout attempt. On Wednesday’s nightly newsletter titled “Decompression Coming?” I had a short pivot of 5207.5 to get anything started for sellers which triggered overnight to put in a low of 5195 and then seeing buyers step in once more attempting to set up a reclaim which I updated into the premarket post via X.
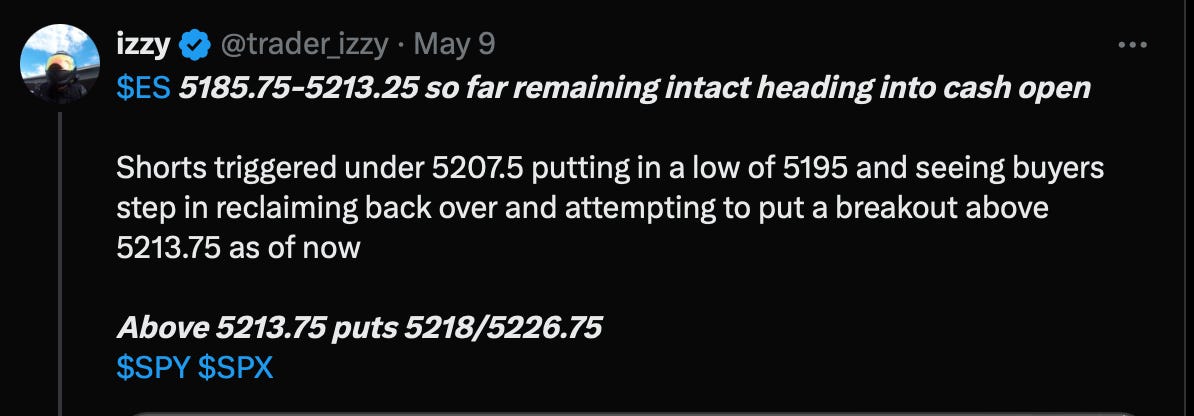
Seeing no signs of aggressive sellers since testing back within the zone since Monday session, and reclaiming back over 5207.5 short pivot into Thursday indicating weakness of sellers unable to follow through on the trigger, this lived up to Wednesday’s title of decompression. Buyers followed through above 5213.25 from the reclaim of 5207.5 setting a breakout and hitting upside targets of 5236.5 and 5257.5 to close the week.
Heading into this week, buyers have a major support of 5188.75 to defend on any sells, if any hit the tape to keep this upside move in play in the longer term to challenge the ATH’s at 5333.5. Heavy economic filled week as well which is sure to move the market and hopefully put some volatility in our hands because volatility is what brings opportunities for us traders. Let’s get into what’s next.
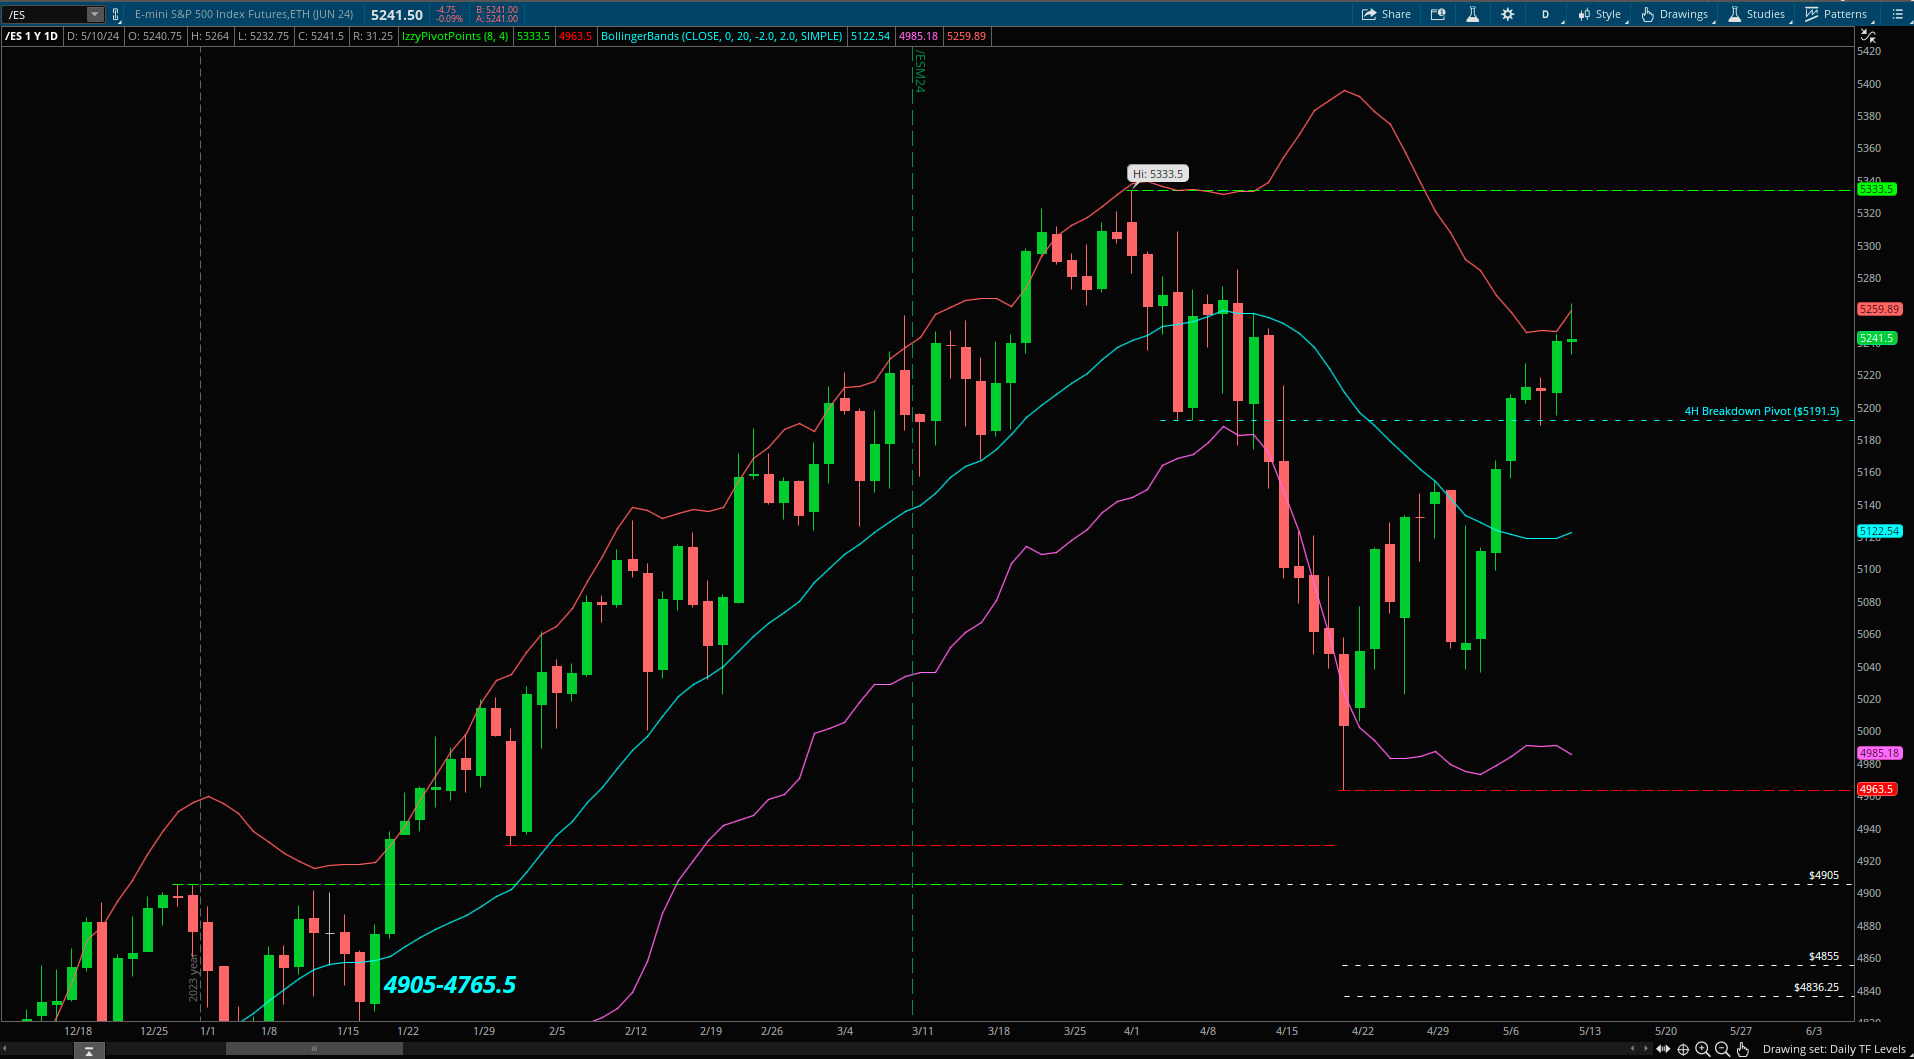
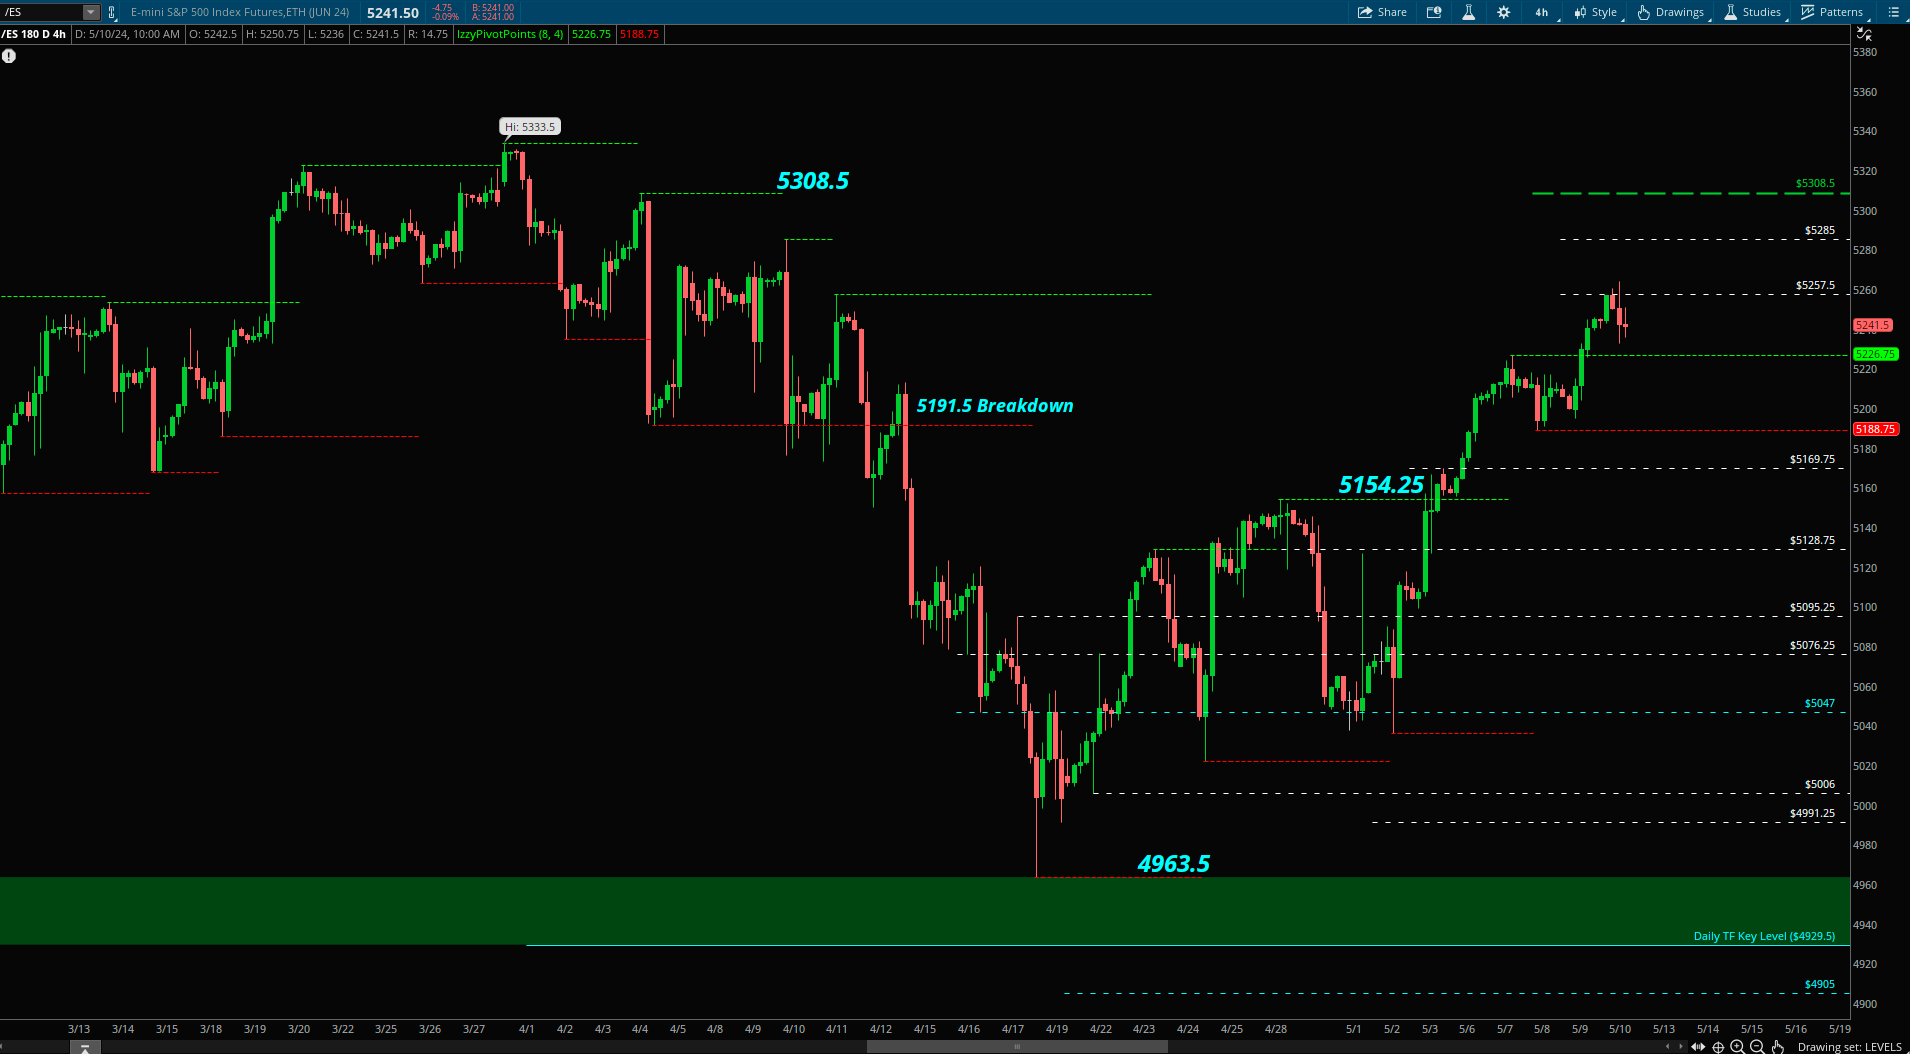
Daily Timeframe Range 5333.5-4963.5
Here is the much bigger view and where the market is trading at.
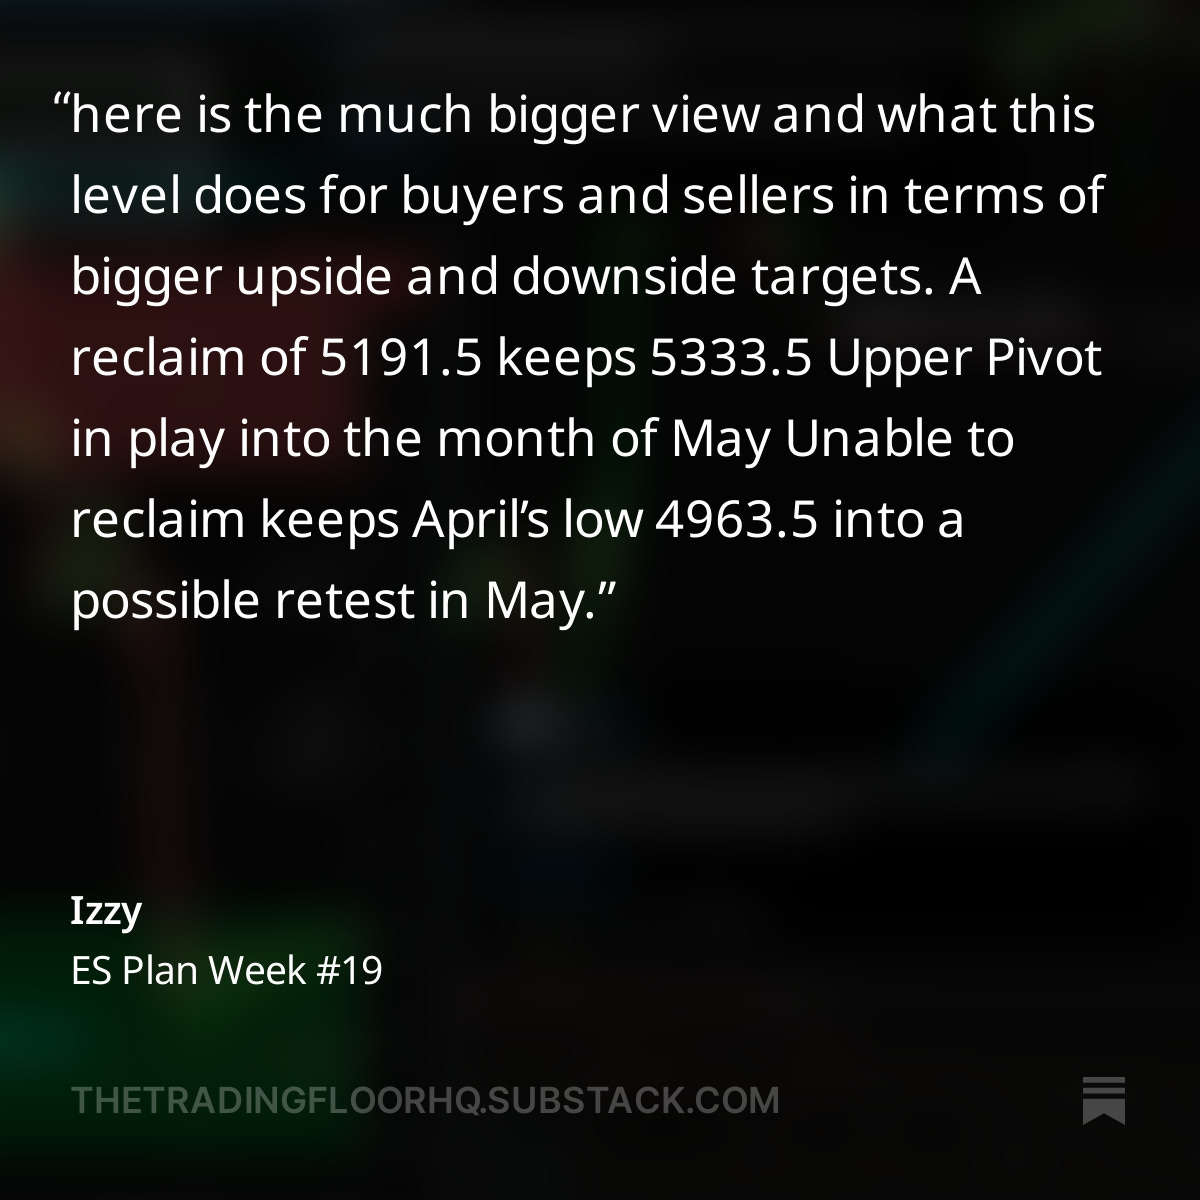
In last weekend’s newsletter we talked about how reclaiming back over 5191.5 support is very key to set up to challenge the ATH’s being the upper pivot here at 5333.5. One step closer heading into this week now on this much bigger timeframe view, and all about defending 5188.75 support now to set up the upper pivot of this Daily Timeframe- 5333.5
Same view remains here on this support level now at 5188.75 which will be the clue where the market wants to move.
4H Timeframe Pivots Range 5188.75-5226.75
As we reviewed above in ES Plan Week #19, Thursday’s reclaim of the short pivot at 5207.5 is what triggered a move into 5213.25 that would set up 5226.75 upper pivot to get moving higher.
This right here is the first level of support [5226.75] for buyers to hold to keep immediate upside in play heading into this week.
Failing to hold over puts the market back within 5226.75-5188.75 range and can create selling pressure putting the sell trigger of 5188.75 into play.
We are currently exploring right back into the previous range of 5308.5-5191.5 the market was in before seeing the breakdown of 5191.5 that led to the April lows. It is possible to see the market “pause” within here and see some type of consolidation before setting up a bigger move.
Based on this timeframe, 5188.75 is a key level into this week for buyers to hold to keep the ball in their court. Failing to hold on any scenario we come to revisit back here, I would be cautious with longs as this is the bigger sell trigger.
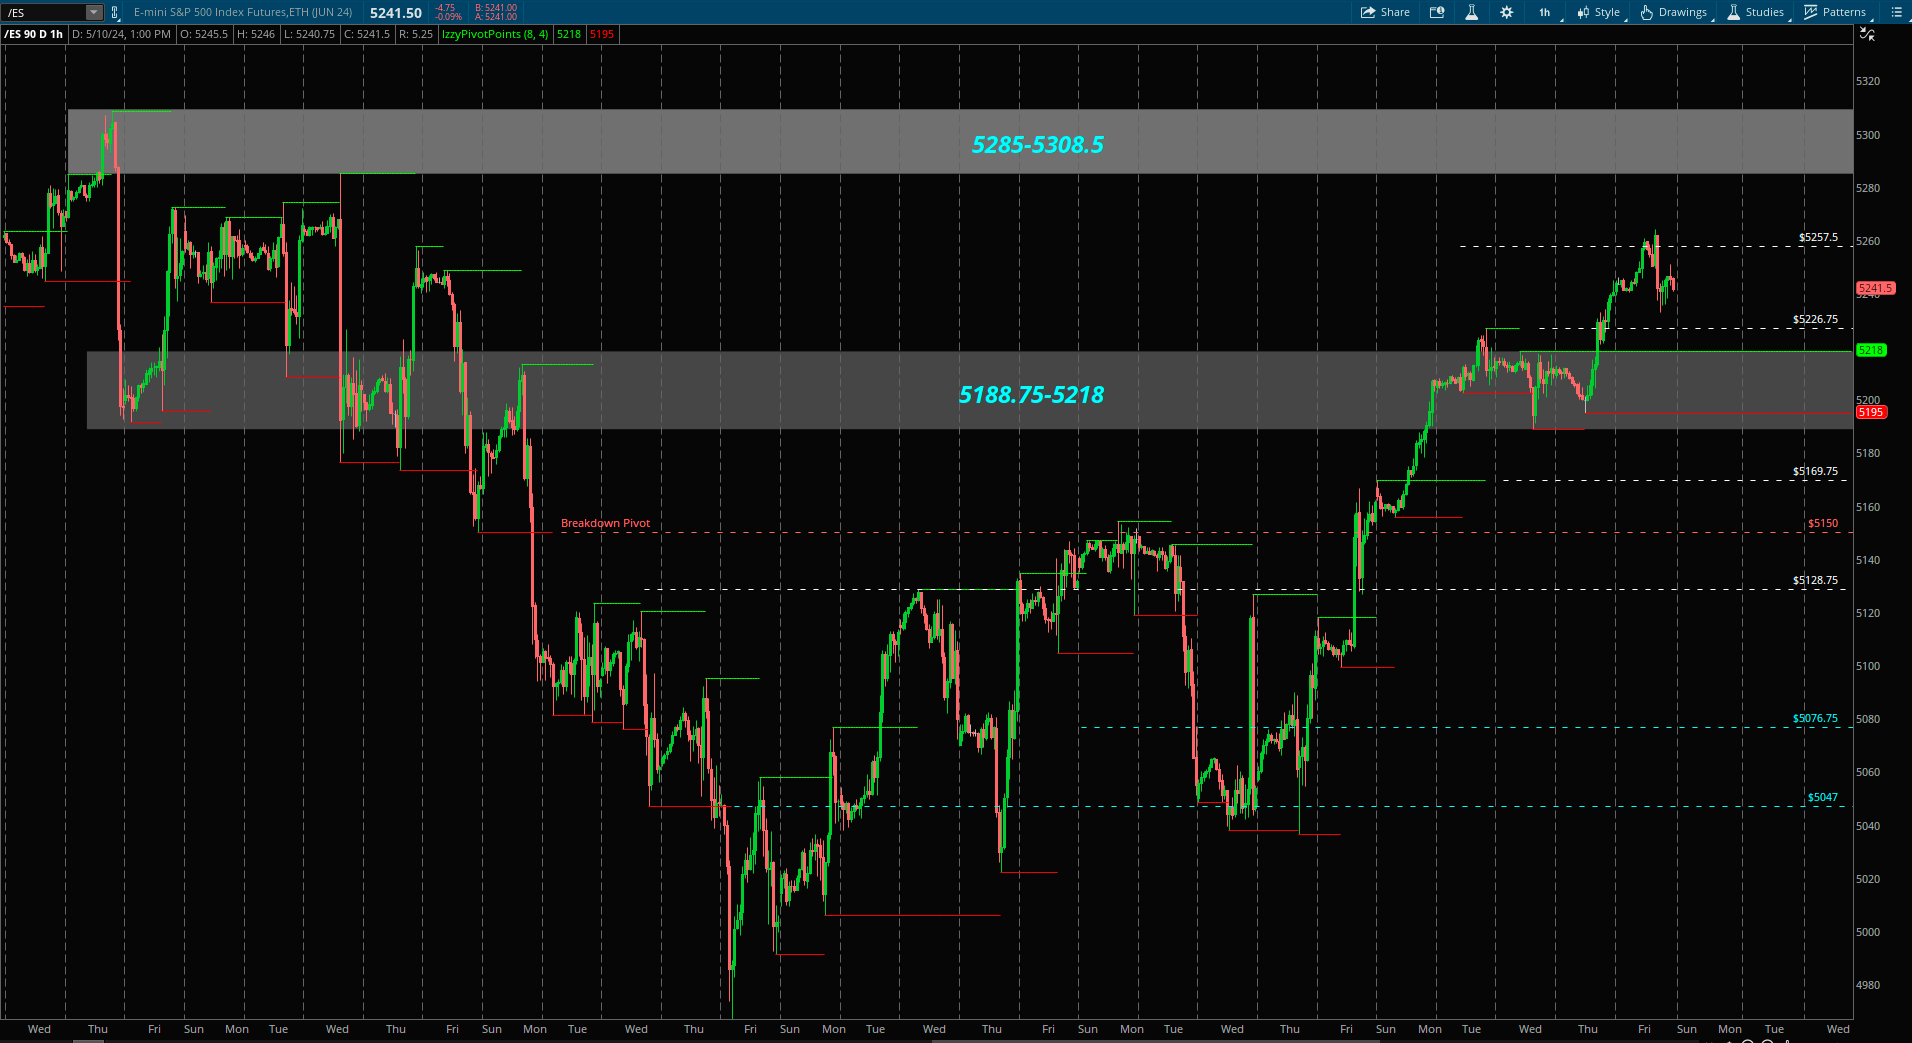
1H Timeframe
Pivots in this timeframe is where we are pulling this updated range of 5188.75-5218.
Zooming in a smaller timeframe we get a little more detail here. Above in the 4H range, if readers are following, I mentioned the market is testing back into the previous range of 5191.5-5308.5 before setting the April lows.
Zooming in, we see that 5188.75-5218 remains a very important zone for buyers to hold to keep this rally alive. As long as 5188.75-5218 holds, the bigger target zone we are looking at short term is the next area of liquidity above at 5285-5308.5
This 5285-5308.5 zone is what buyers must reclaim to open the doors into the daily upper pivot of 5333.5. To keep this scenario alive, 5188.75-5218 must hold.
Failure of 5188.75-5218, sets up 5169.75/5154.25/5128.75-5104.5 (More on this below)
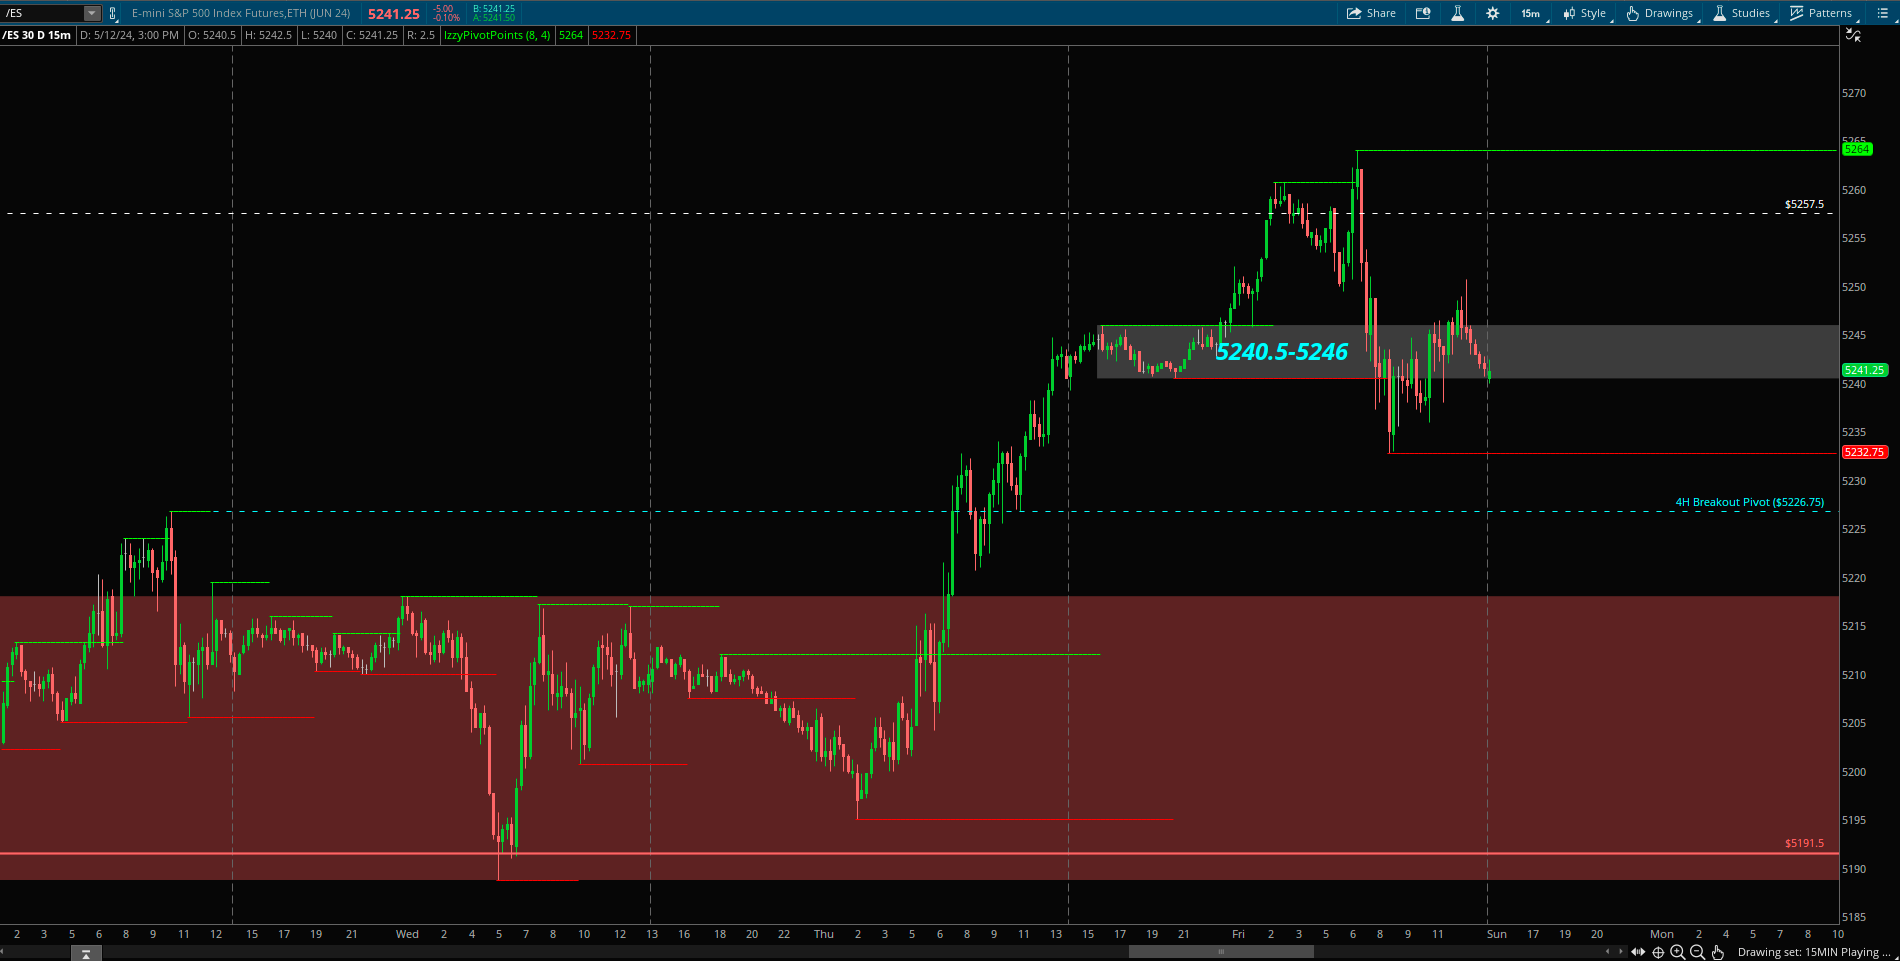
15Min Playing Field- Putting It All Together
Sell Zone 5285-5308.5
Buyer Zone 5188.75-5218
Intraday Range As Of Now 5264-5232.75
Upside
Best case scenario favoring bulls here is to maintain above 5240.5 to trigger back over 5246 to retest back into the previous week highs at 5257.5-5264. Breaking over 5257.5-5264 is the gate way into 5285-5308.5 upper 1H target zone.
Under 5240.5 it would be best to wait to see if 5188.75-5218.5 comes. This is the area I will be watching to hold to keep longs in play and long entry zone.
As mentioned above, failure of 5188.75 I would be more cautious with longs as this would signify a failure of reclaiming this zone.
Areas below 5188.75 that I would be interested in to watch for buyer activity is at 5154.25 and 5128.75-5104.5
Downside
The first trigger to put shorts into play is at 5232.75 to set up 5226.75/5218-5188.75
We have yet to see any real sells come in which leaves the question on the table of how well do buyers deal with it. Seeing failure of 5232.75 gets the move targeting back into 5218-5188.75 zone. This is an area of interest for buyers, keep that in mind. Real momentum begins at the trigger of 5188.75 targeting 5169.75/5154.25/5218.75-5104.5.
As mentioned, we really haven’t seen any real seller activity. If buyers continue the move higher to start off the week, I would just wait for 5285-5308.5 to see if that’s where they step into/ manage risk into longs/ look for shorts. There has not been any follow through on the short signal to put shorts into play. That is something to keep in mind heading into this week and see if that changes.
We have some market moving catalyst into this week. Best to take it level to level as always and focus into these zones, one session at a time without losing sight of the bigger timeframe view in the background. These smaller timeframes is what will define for us where the daily timeframe wants to head into first.
With buyers holding 5188.75-5218, and seeing buys come in sets up 5285-5308.5 which signals the challenge into 5333.5 ATH’s in play… one step closer at least.
Failure of 5188.75-5218 is obvious that we start to deviate from that upside scenario which signals to us that it is possible to head lower into the lower part of the daily timeframe range and could be fast. This allows us to adjust and adapt if we are caught on the wrong side. In trading we are always at the edge of failure which the need to adapt and adjust is so crucial. Losses are inevitable in trading, it’s okay to be wrong, we are all going to lose. What is not okay is the charts deviating away and showing us that maybe the scenario we are looking for is not happening. With this in place, this is where it is not okay holding losing positions with the charts showing us we are wrong and staying stubborn causing blow ups. This is not the way into consist profitable trading.