
ES Plan Week #18
I update via X based on this plan as the market session unfolds in real time. Make sure to follow for the real time market updates! X (Twitter)- trader_izzy

Daily & Weekly Timeframe Review
If readers recall, towards the end of March sellers triggered a breakdown of a very important level pulled from the weekly timeframe; 6525. This 6525 level was very important as this was the lower end of the weekly timeframe range, the BIGGEST range the market has been trading sideways in (6525-7043 unadjusted weekly timeframe). Sellers broke down the market under 6525 on 03/27 however two sessions later on 03/31, sellers quickly failed to maintain the breakdown move. This triggered a failed breakdown set up on the weekly timeframe as recovering back over 6525 put the market to trade back inside of the weekly range which currently remains set at 6525-7043 (7077). That’s the biggest takeaway I want readers to really grasp. The sell off in March only set up the market to make a full round trip into the lower end of the weekly timeframe range. Testing into 6525, sellers broke the market down out of the weekly timeframe range (7077-6525). Looking underneath the weekly timeframe range sellers immediately failed to maintain the breakdown move which resulted with the market recovering back over 6525… and from a technical analysis perspective what that meant for us traders was that recovering 6525 essentially kept the market in consolidation within 6525-7077.
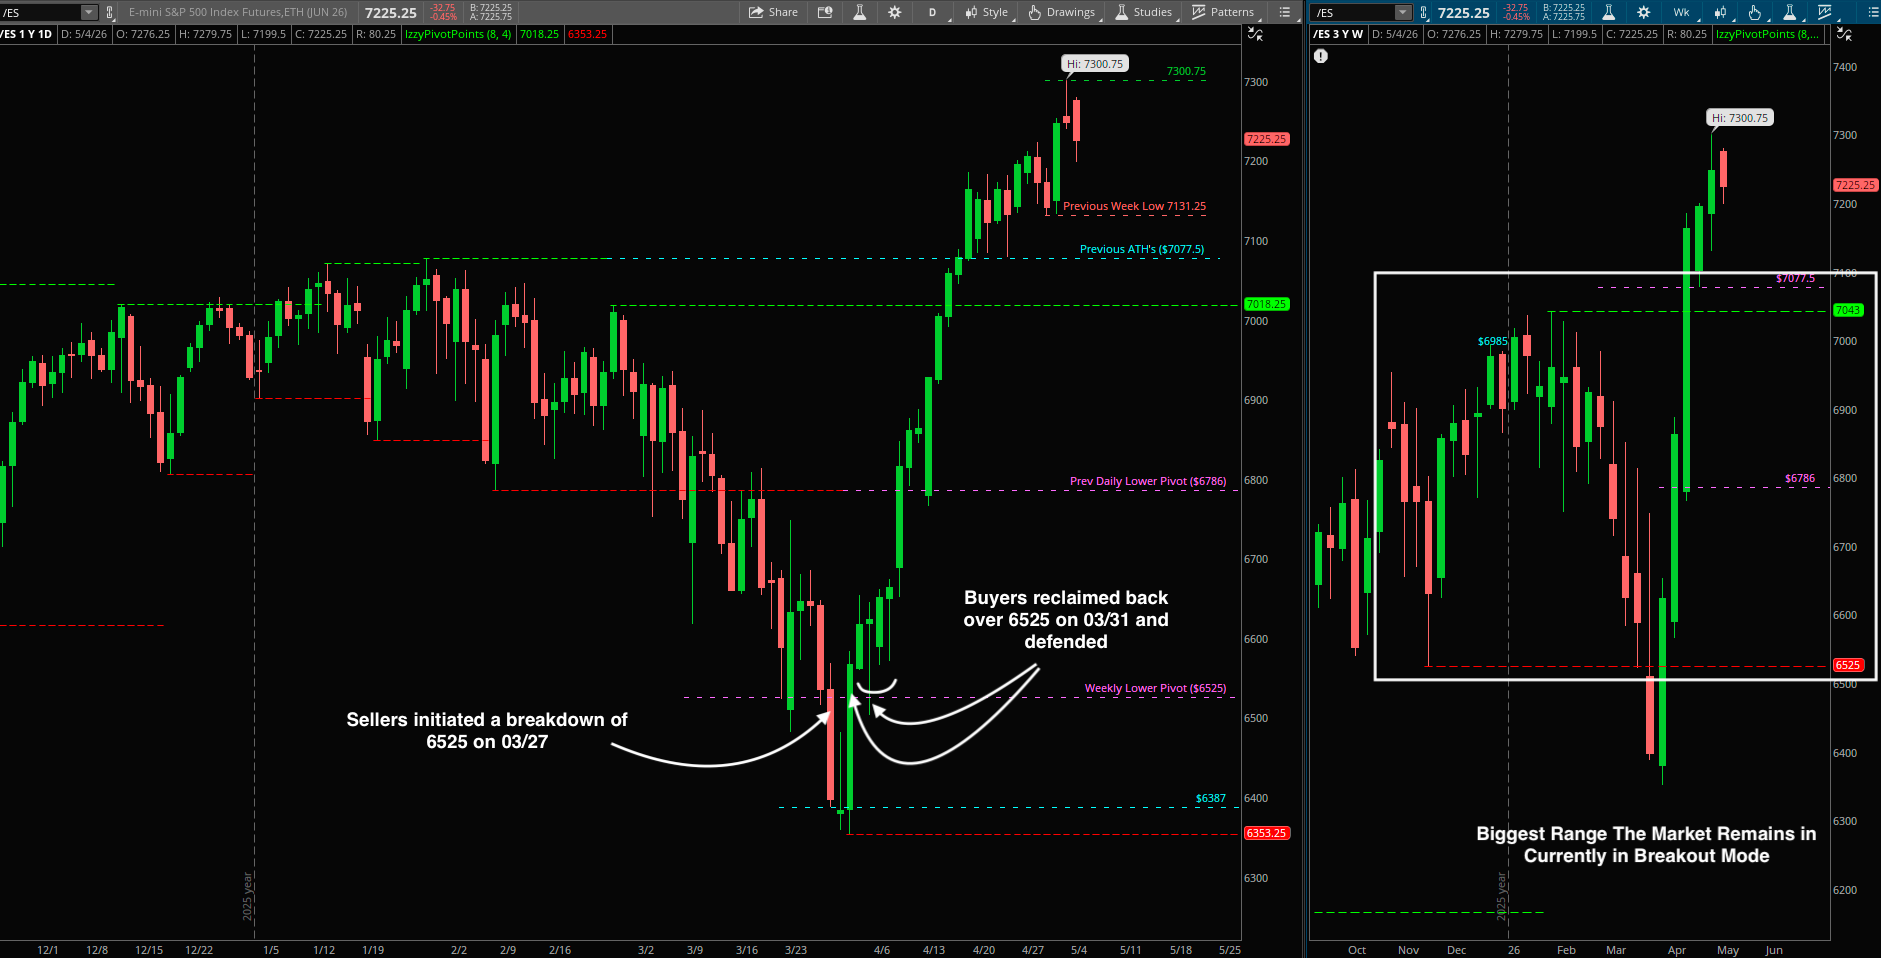
Since recovering 6525, fast forward 4 weeks later… the market has completed a full round trip back into the upper end of the bigger sideways movement (7018-7077) and has even triggered a break out trade.
Viewing the market from a weekly timeframe…
Since the reclaim of 6525 on 03/31, the market has been on a 4 week continuation streak… pushing and closing higher on a weekly basis. As we view the market from the weekly timeframe it is clear that there is not much to do but keep trailing this upside move until something different shows up. In other words… the trend is our friend until the very end!
That’s what I will be digging into on this newsletter…
What keeps the market in potential continuation mode (on weekly timeframe)
Where the market starts deviating away from continuation
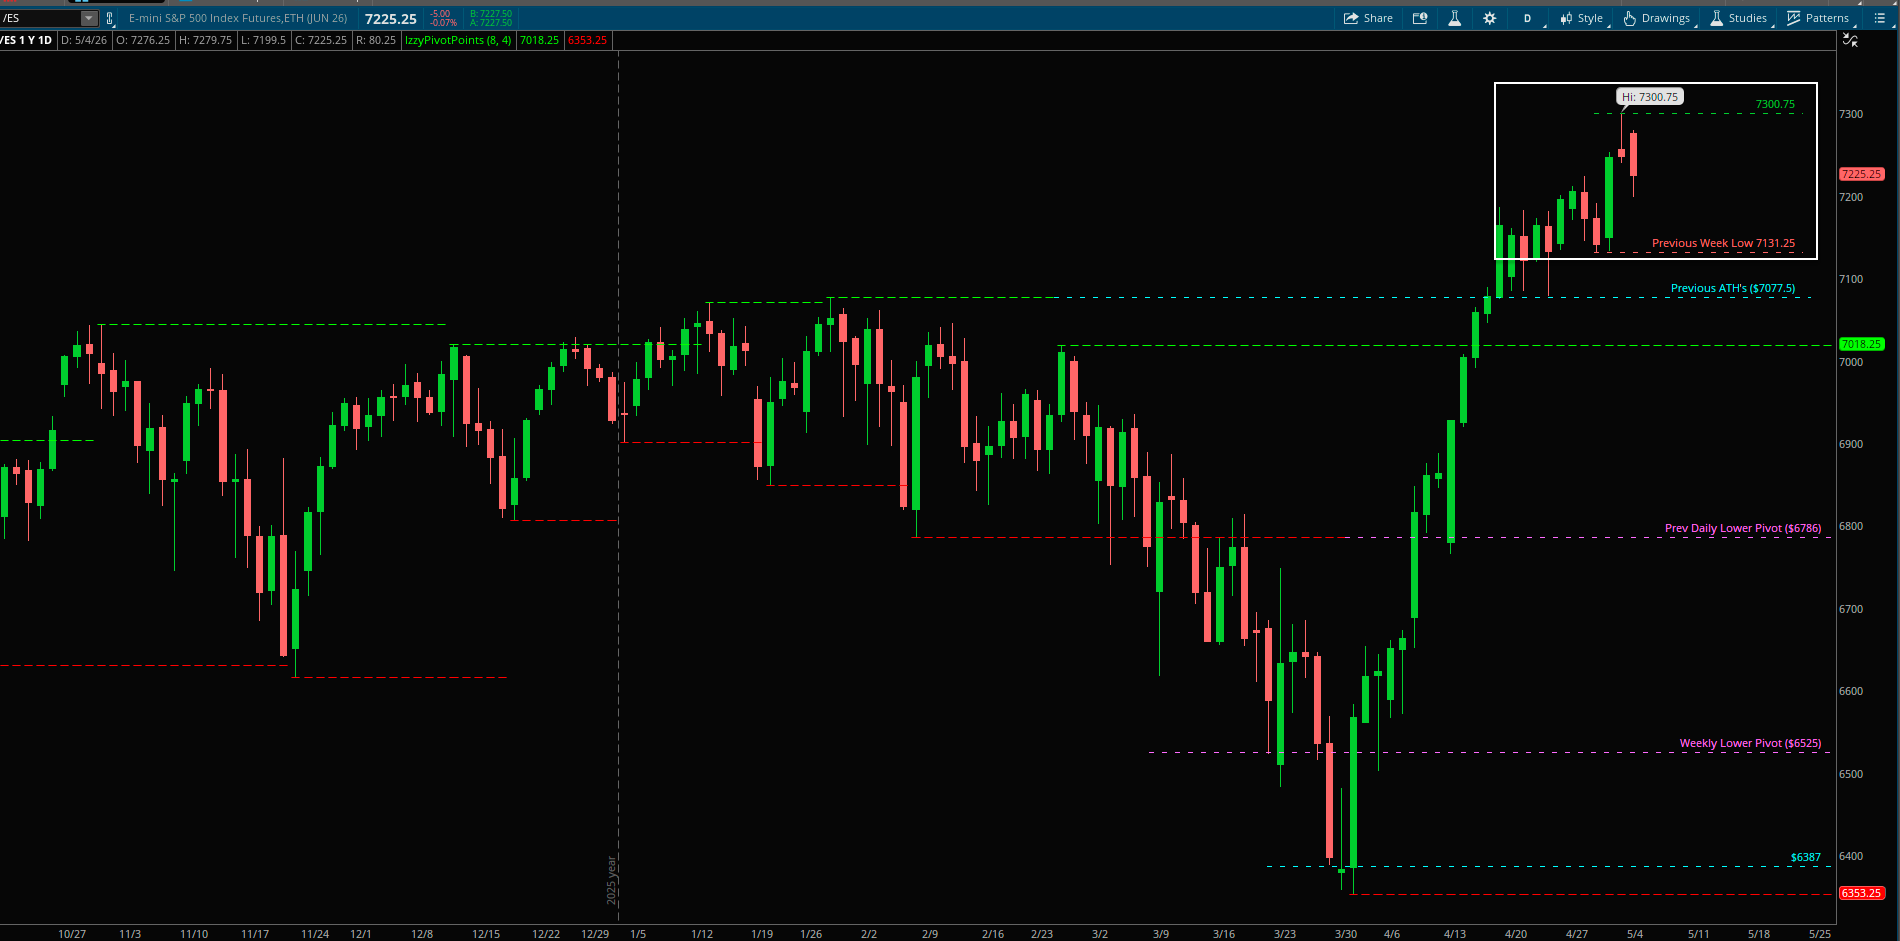
As of right now, the market remains inside of the previous week high (7300) and low (7131). Taking this in consideration, let’s zoom in!
4H Timeframe Range Pivots 7131-7300 (Wider Range)
Zooming in a timeframe lower brings us to the 4H.